Question #70266
1 Answer

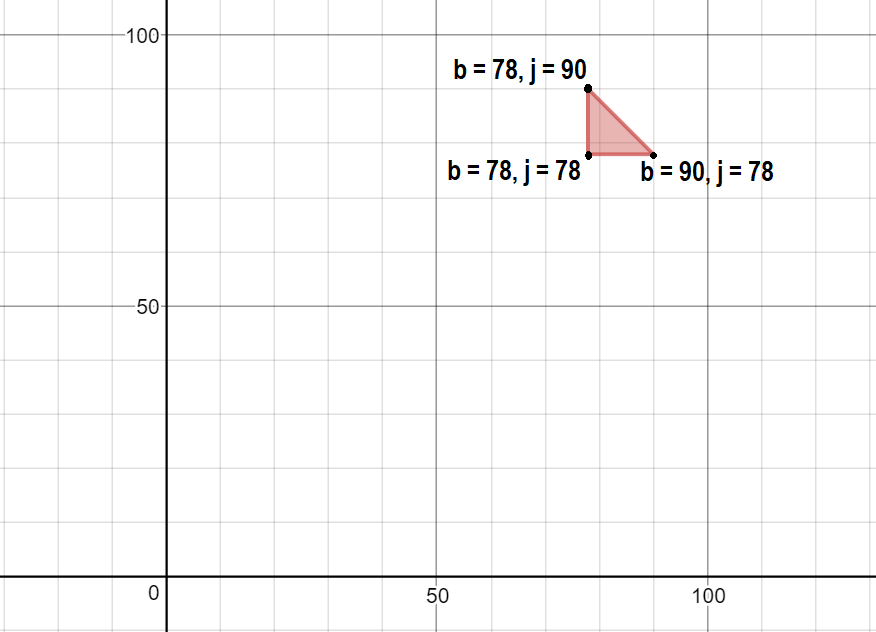
Representing Ben's score on the x axis and Jim's score on the y axis, the set of all possible scores for Ben and Jim is:
Explanation:
Let's call Ben's score
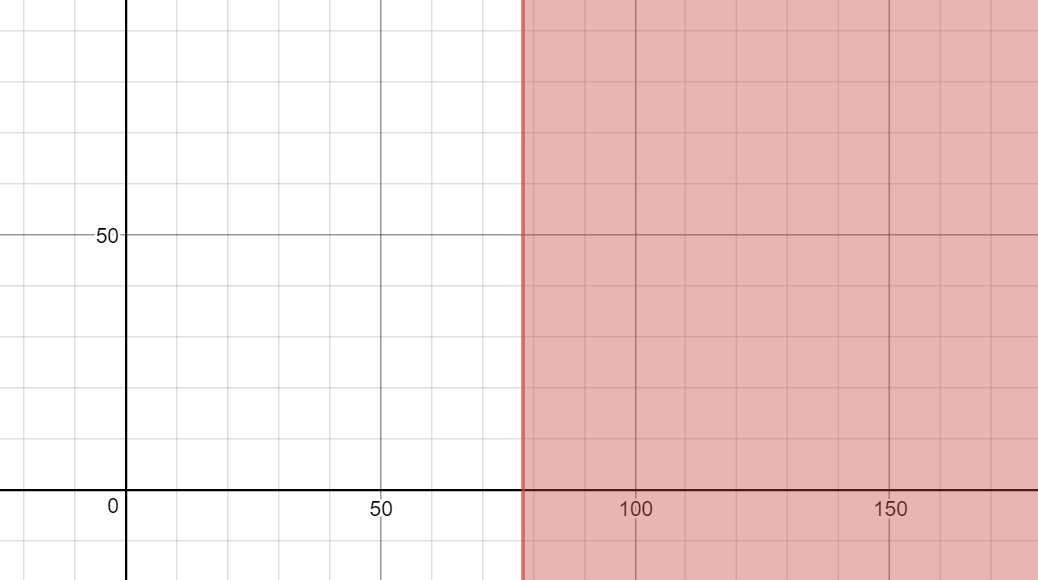
#b ge 78#
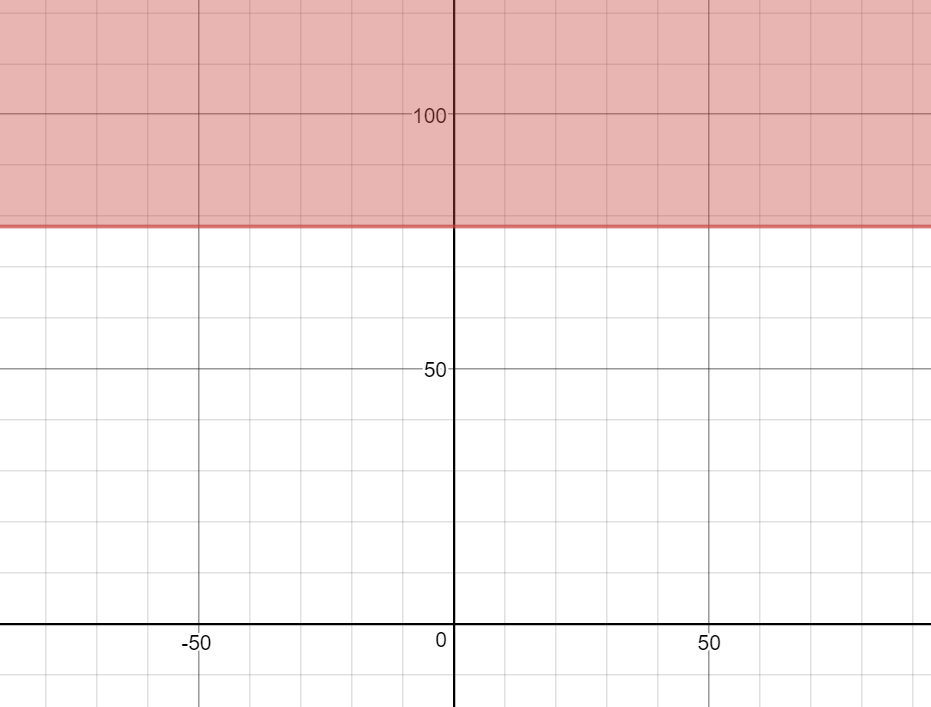
#g ge 78#
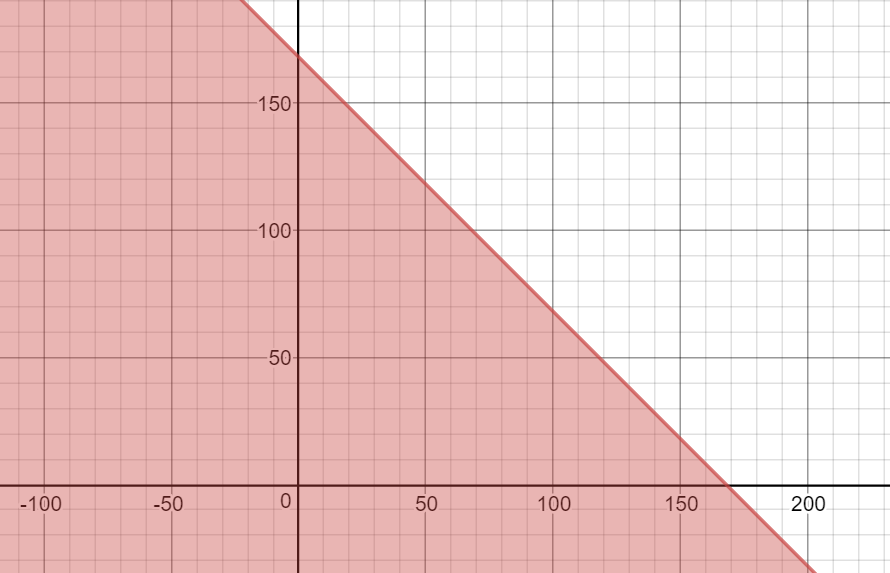
#b + g le 168#
This gives us a system of inequalities with two variables. This means that the best way to represent our solution set is on a coordinate plane.
Let's put Ben's score on the x-axis. We know his score must not be less than 78, so that gives us this inequality:
Let's also put Jim's score on the y-axis. We know his score must also not be less than 78, so that gives us this inequality;
Finally, we know that their combined score cannot be greater than 168, which we can represent on this graph by the inequality
If we put all three of these inequalities on the graph at the same time, we see that there is a small area of overlap between them.
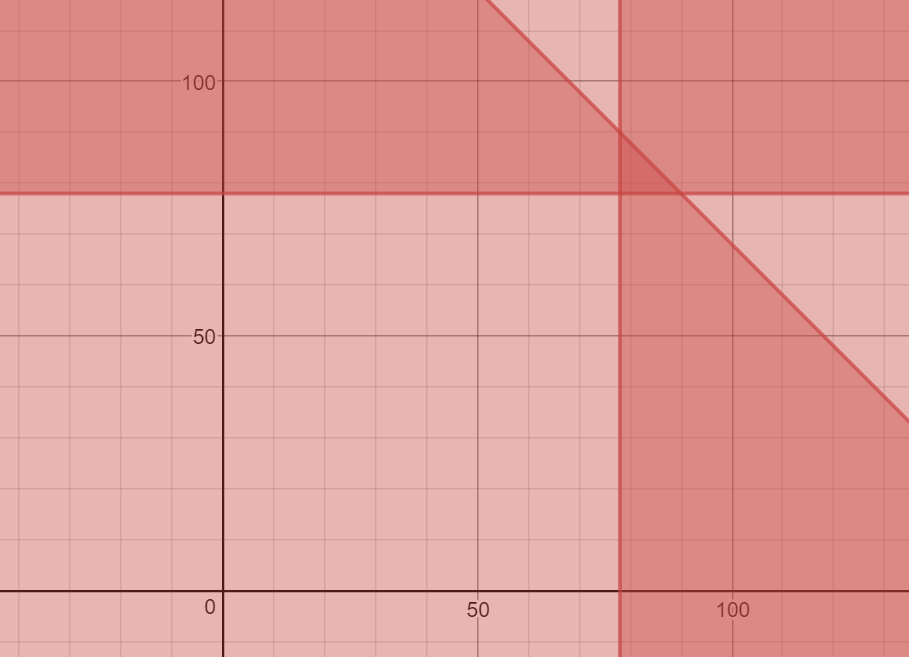
This area of overlap is our solution set. Representing Ben's score with
Final Answer
