How do you graph #y=(1/5)^x# and #y=(1/5)^(x-2)# and how do the graphs compare?
2 Answers

Graph them by manually calculating points and plotting them, or use a spreadsheet or plotting program.
Explanation:
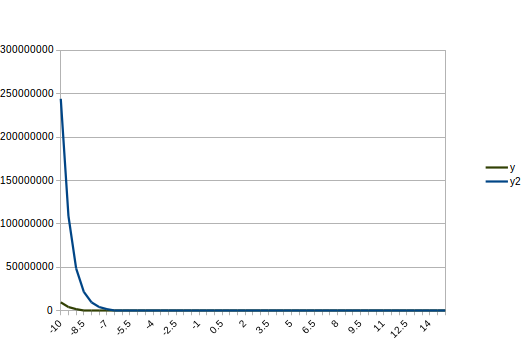
No matter where you put the range of values, the relative shape of the two curves remains the same. Both are inverse exponential curves (logarithmic curves) with an asymptote at y = 0.
See below.
Explanation:
Graph 1:
This has the graph of the standard negative exponential function
- The graph passes through the point
#(0,1)# - The domain is
#(-oo,+oo)# - The range is
#(0, +oo)# - The graph is decreasing
- The graph is asymptotic to the x-axis as
#x -> +oo# - The graph increases without bound as
#x -> -oo# - The graph is smooth and continuous.
This graph is shown below.
graph{(1/5)^x [-10, 10, -5, 5]}
Graph 2:
This is the Graph 1 above scaled by 25 as shown below..
graph{y=(1/5)^(x-2) [-10, 10, -5, 5]}
This graph has all the properties of Graph 1 above except that it passes through the point
