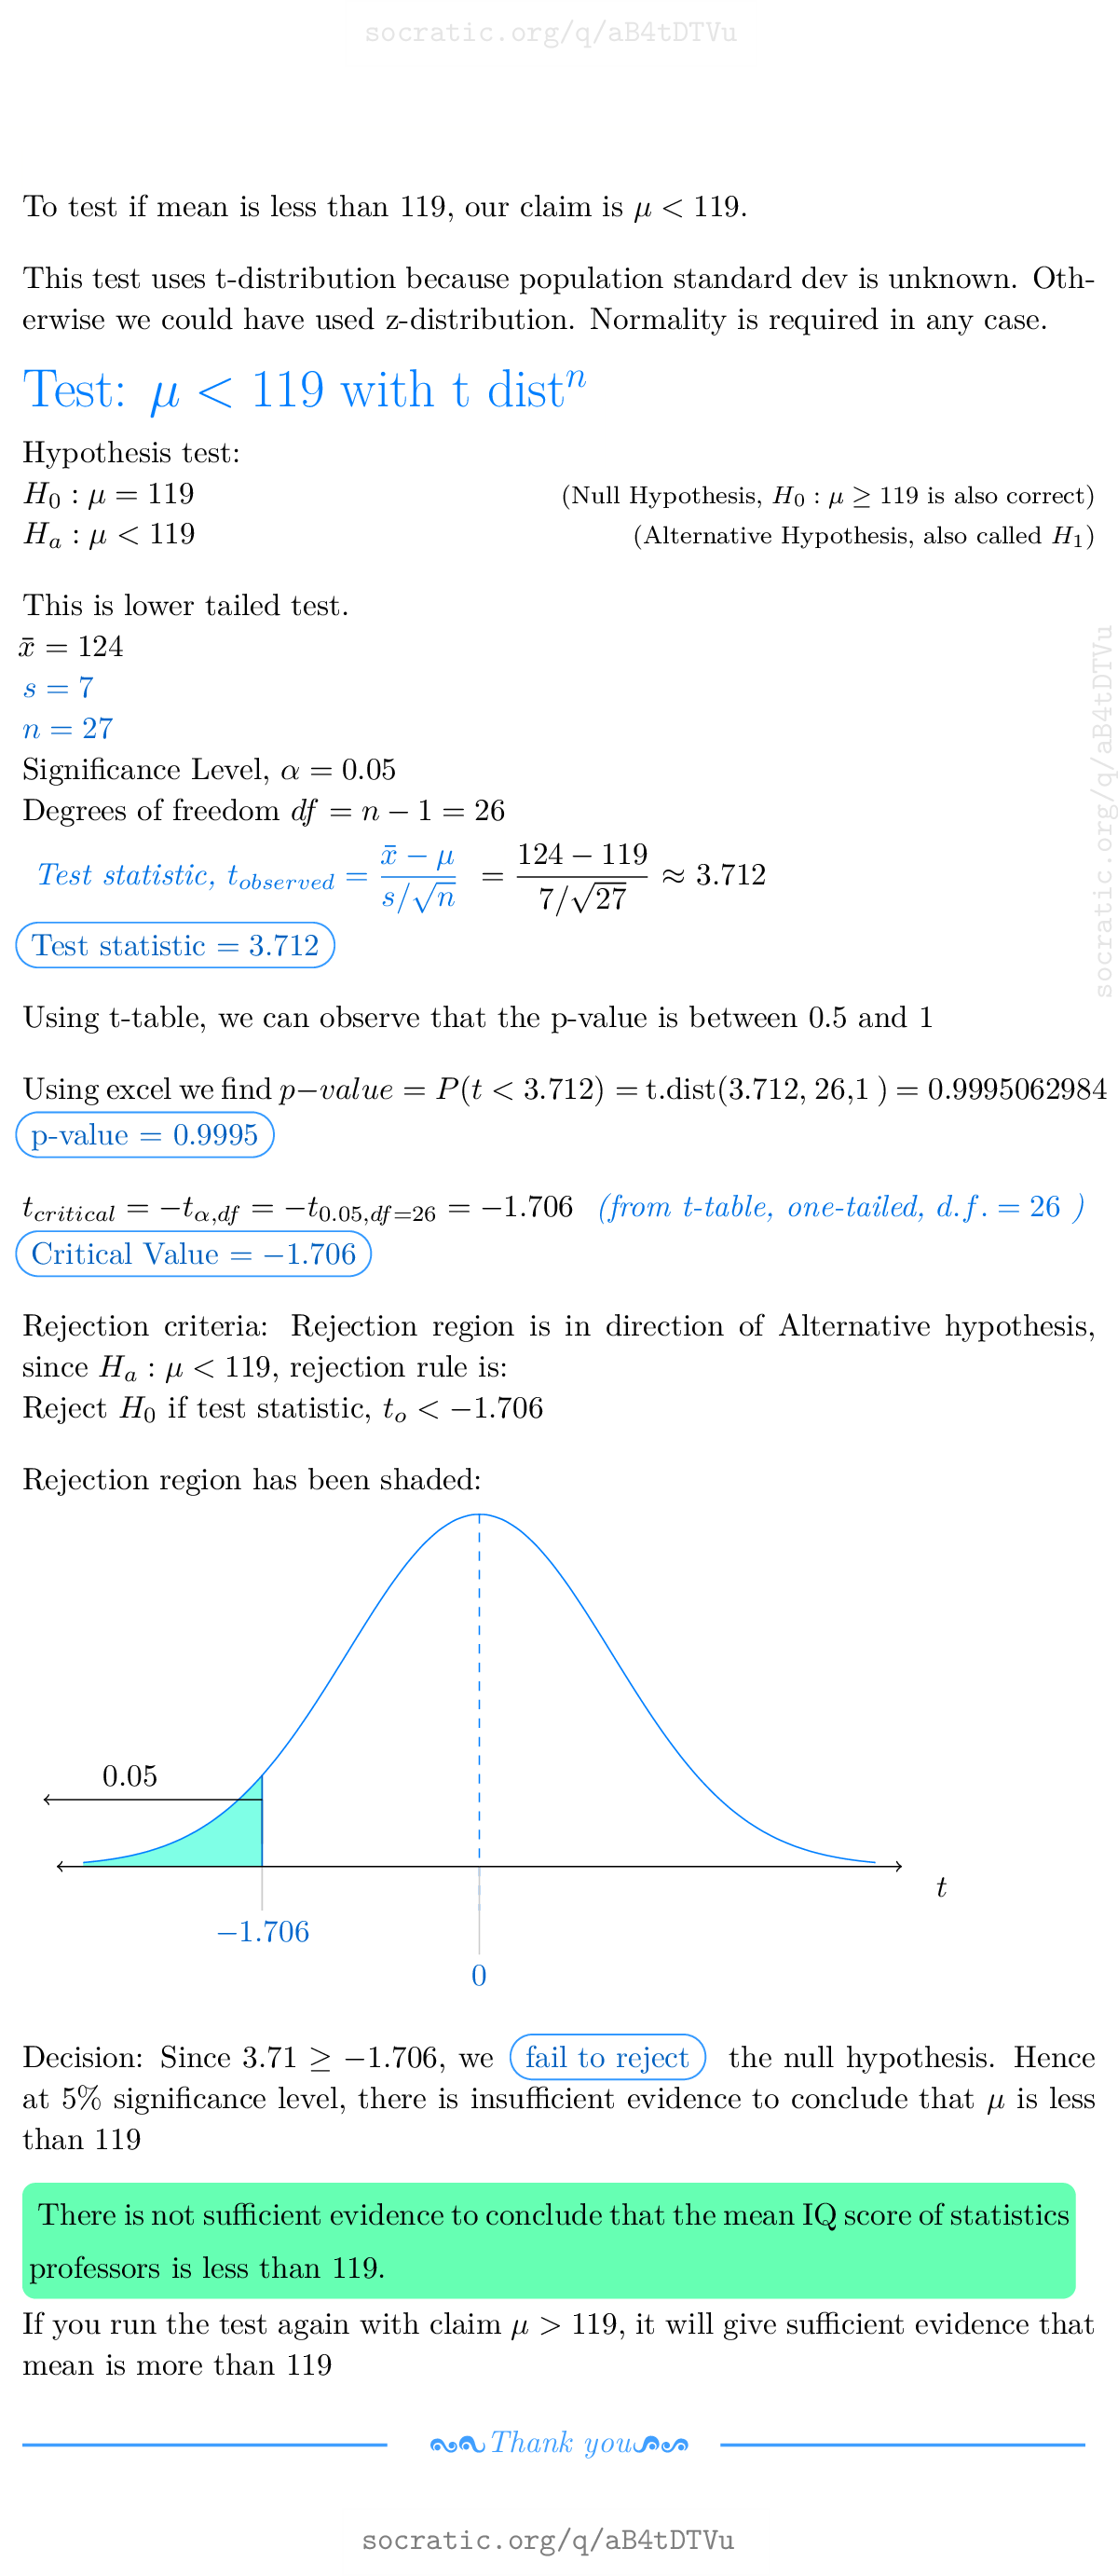
The mean IQ score of statistics professors is less than 119. The significance level is 0.05. What is the null hypothesis (H0) and alternative hypothesis (H1)?
Assume that a simple random sample has been selected from a normally distributed population.
What is the test statistic t?
What is the P-value?
How do you find the critical value using a t-distribution table?
What can you conclude?
n = 27, x-bar = 124, s = 7.
Assume that a simple random sample has been selected from a normally distributed population.
What is the test statistic t?
What is the P-value?
How do you find the critical value using a t-distribution table?
What can you conclude?
n = 27, x-bar = 124, s = 7.
1 Answer

Dec 10, 2017