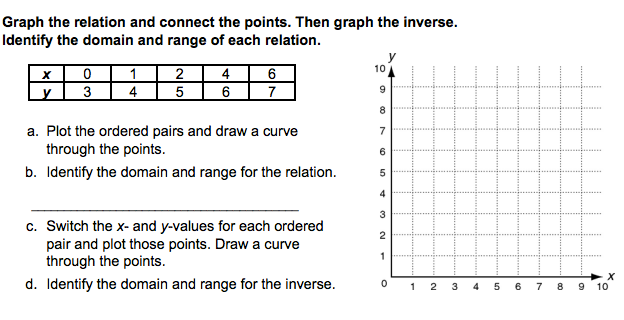
Can you please help me?
1 Answer

See the solution below.
Explanation:
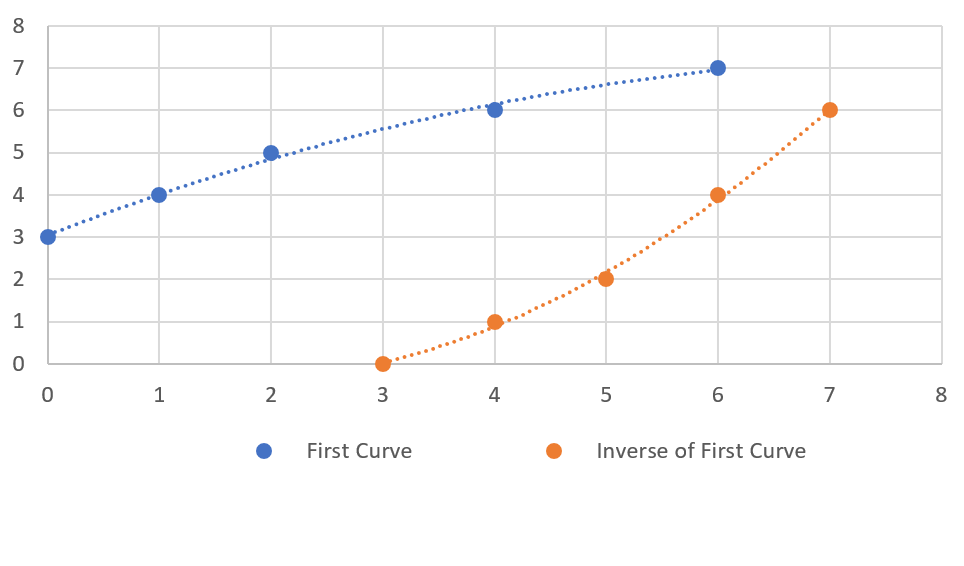
a. I have provided what the graph should look like along with its inverse.
b. To find the domain and range all we have to do is look at the table.
The domain is all the x-values for which the function is defined so we just list all the
Therefore, the Domain is
Similarly, the range are all the
Range:
c. (see a) Note: To graph the inverse, just switch the
d. The domain and range for the inverse will be the domain and range of the first curve we drew but switched. That is to say that the domain of the first curve will be the range of the inverse curve and the range of the first curve will be the domain of the inverse curve.
Thus,
Domain:
Range:
