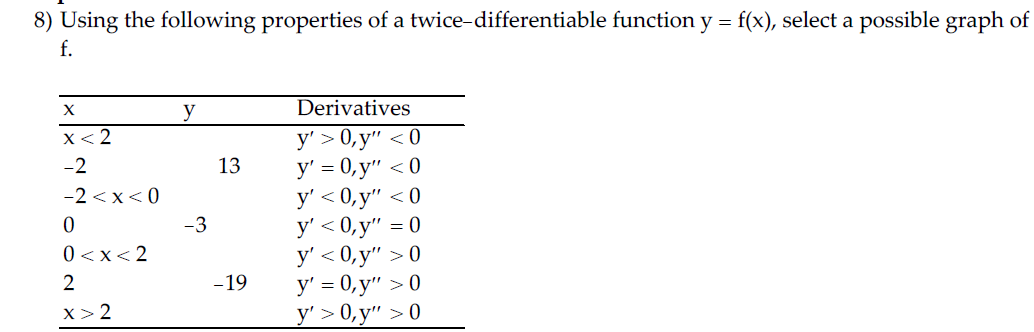
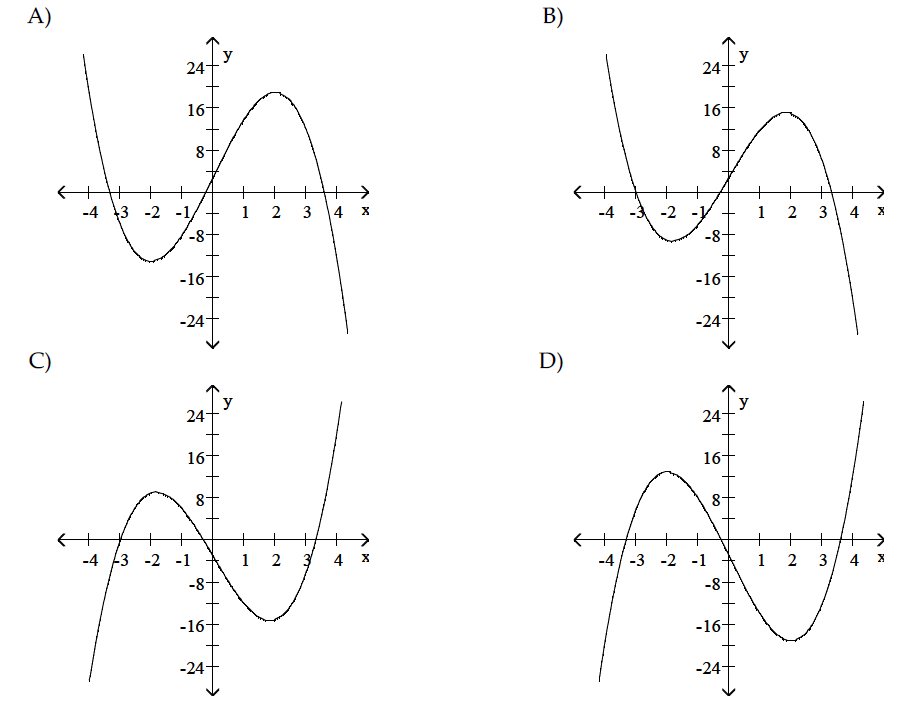
How can I determine the graph using the properties ?

enter image source here

enter image source here

2 Answers
Jan 5, 2018

#D#

Explanation:

We know when #f'(x)=0# this indicates a maximum or minimum point. From the table this is at #(-2, 13)# and #( 2 , -19)#. Looking at the graphs this indicates either A or D. We know for a maximum point #f''(x)<0# and for a minimum point #f''(x)>0#. From the table #f''(x)<0# at #( -2 , 13#) and #f''(x)>0# at #( 2 , -19)#. Looking at graphs of A and D. D has maximum at #( -2 , 13)# and a minimum at #( 2 , -19)#

So D is the graph represented by the table.

Jan 5, 2018

#D#

Explanation:

Alright, we take this step by step.
Let's try to exclude some of the graphs for #f# .

Looking at them it's easy to tell that for #x>2# we have the first two where #f# is decreasing and is concave. This doesn't satisfy one of the properties given for #f# which is ( #x>2, f'(x)>0, f''(x)>0# ) which means #f# should be increasing for #x>2# and it should be convex.

With this restriction possible graphs would be either #C# or #D#
If you look at them , they look very identical in their shape so most of the properties should be satisfied by both of the graphs. Take a close look on what's happening in these 2 graphs when #x=-2#

When #x# is #-2#, #y# should be equal to #13# with the given table which if you look it's the case on the #D# graph.
Since one of the properties doesn't satisfy the #C# graph it's enough to assume that graph #D# is the closest approximation we can get to the graph for the function #f#