Can someone help me with these two continuous function problems? Information is in the pictures.
2 Answers

Explanation:
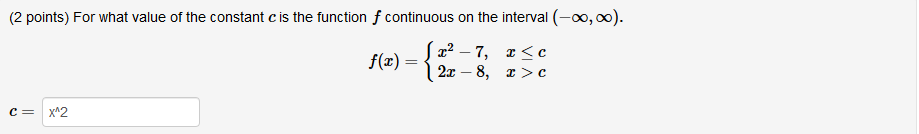
For the first question we need to find the value of
Since
Now solve for
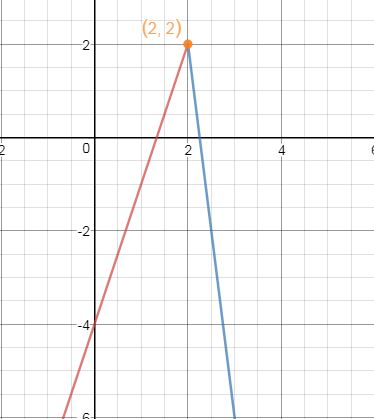
From the image it can be seen the graph is continuous when
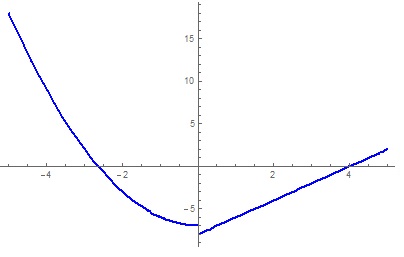
The graph is now clearly broken at
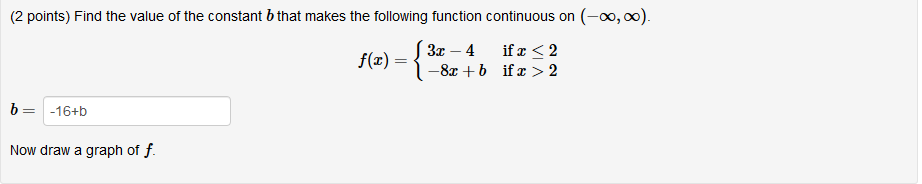
For the second part follow the same procedure:

Explanation:
to find out where one graph ends and another graph starts, you can use the point of intersection.
to find the
then solve for
the
hence, the point of intersection is
when
when
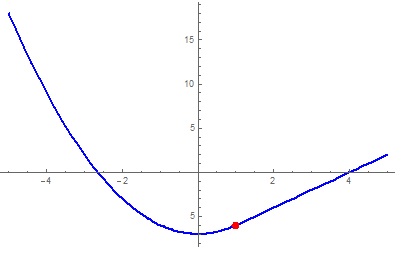
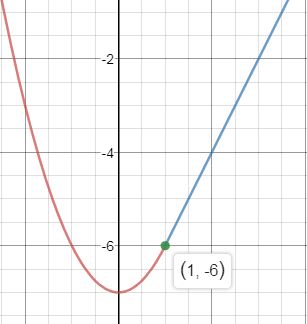
this is the graph:
-
the inequalities
at
this means that
therefore at
the point of intersection is
to draw the graph:
draw the graph of
from there, draw the graph
this is a digital representation: