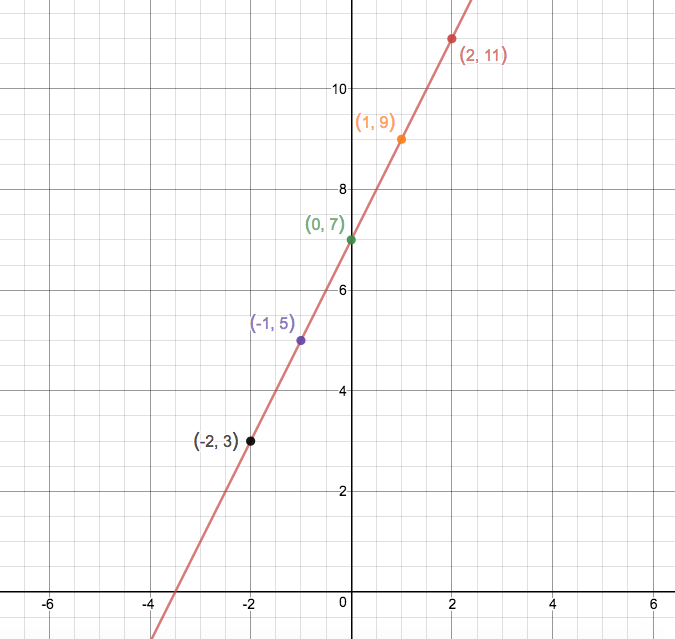
How do you graph the linear equation, y=2x+7?
Please tell me every step because I don't know how to do this stuff.
Please tell me every step because I don't know how to do this stuff.
1 Answer


Graph down below:
Explanation:
Use
Multiply
for
We get
Do this for around 5 values, with some negative and positive:
Now connecting these points, gets a line: