If the area under the curve of f(x) = 25 – x2 from x = –4 to x = 0 is estimated using four approximating rectangles and left endpoints, will the estimate be an underestimate or overestimate?
2 Answers

underestimate
Explanation:
The function is increasing in the interval from
Putting in the numbers, you can easily see that the heights of the four rectangles are
Since each of the rectangles have a width of 1, their total area is 70 units.
On the other hand, the area under the curve is
By the way, this means that if you had used right-endpoints, you would have over4estimated the area (check!!)
Also, the use of left endpoints for the area between

The 4-bar Riemann sum will be an underestimate of the true area.
Explanation:
The rate of change of f(x) is given by its first derivative:
#f(x) = 25 - x^2#
#f'(x) = -2x#
Since our interval is from
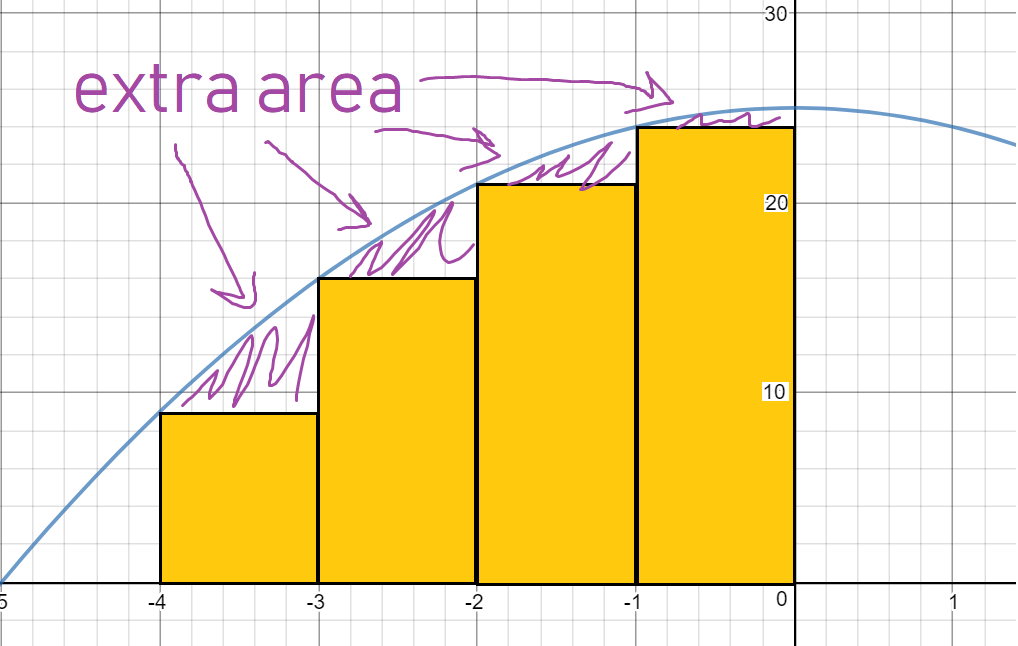
When the function is increasing on the entire interval, a left sum will ALWAYS produce an UNDERESTIMATE of the area.
This is because the bar "levels out" at the leftmost point, while the curve continues to rise above it, covering more area than the bar itself.
If that doesn't quite make sense, here's a picture of the graph with the four left-sum bars. I find that pictures have a way of intuitively explaining things that words just can't convey sometimes. Hopefully this graph helps your understanding of why a left-sum will always underestimate an increasing function.