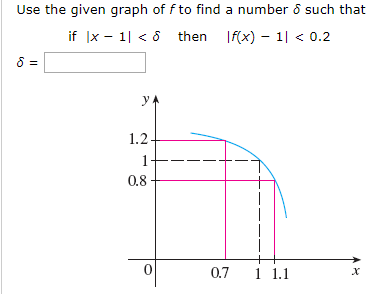
Use the given graph of f to find a number delta...?
I'm not really sure what to do here. I think the first step is to set the equation equal to each other?
I'm not really sure what to do here. I think the first step is to set the equation equal to each other?
1 Answer

Feb 14, 2018
That's the easy one!
Explanation:
Seriously, you'll like this.
The red horizontal segments are distance 0.2 away from 1. These are
The corresponding red vertical segments are at
Choose
In other words,
