What is an inequality for the attached graph?
1 Answer

Mar 2, 2018
Explanation:
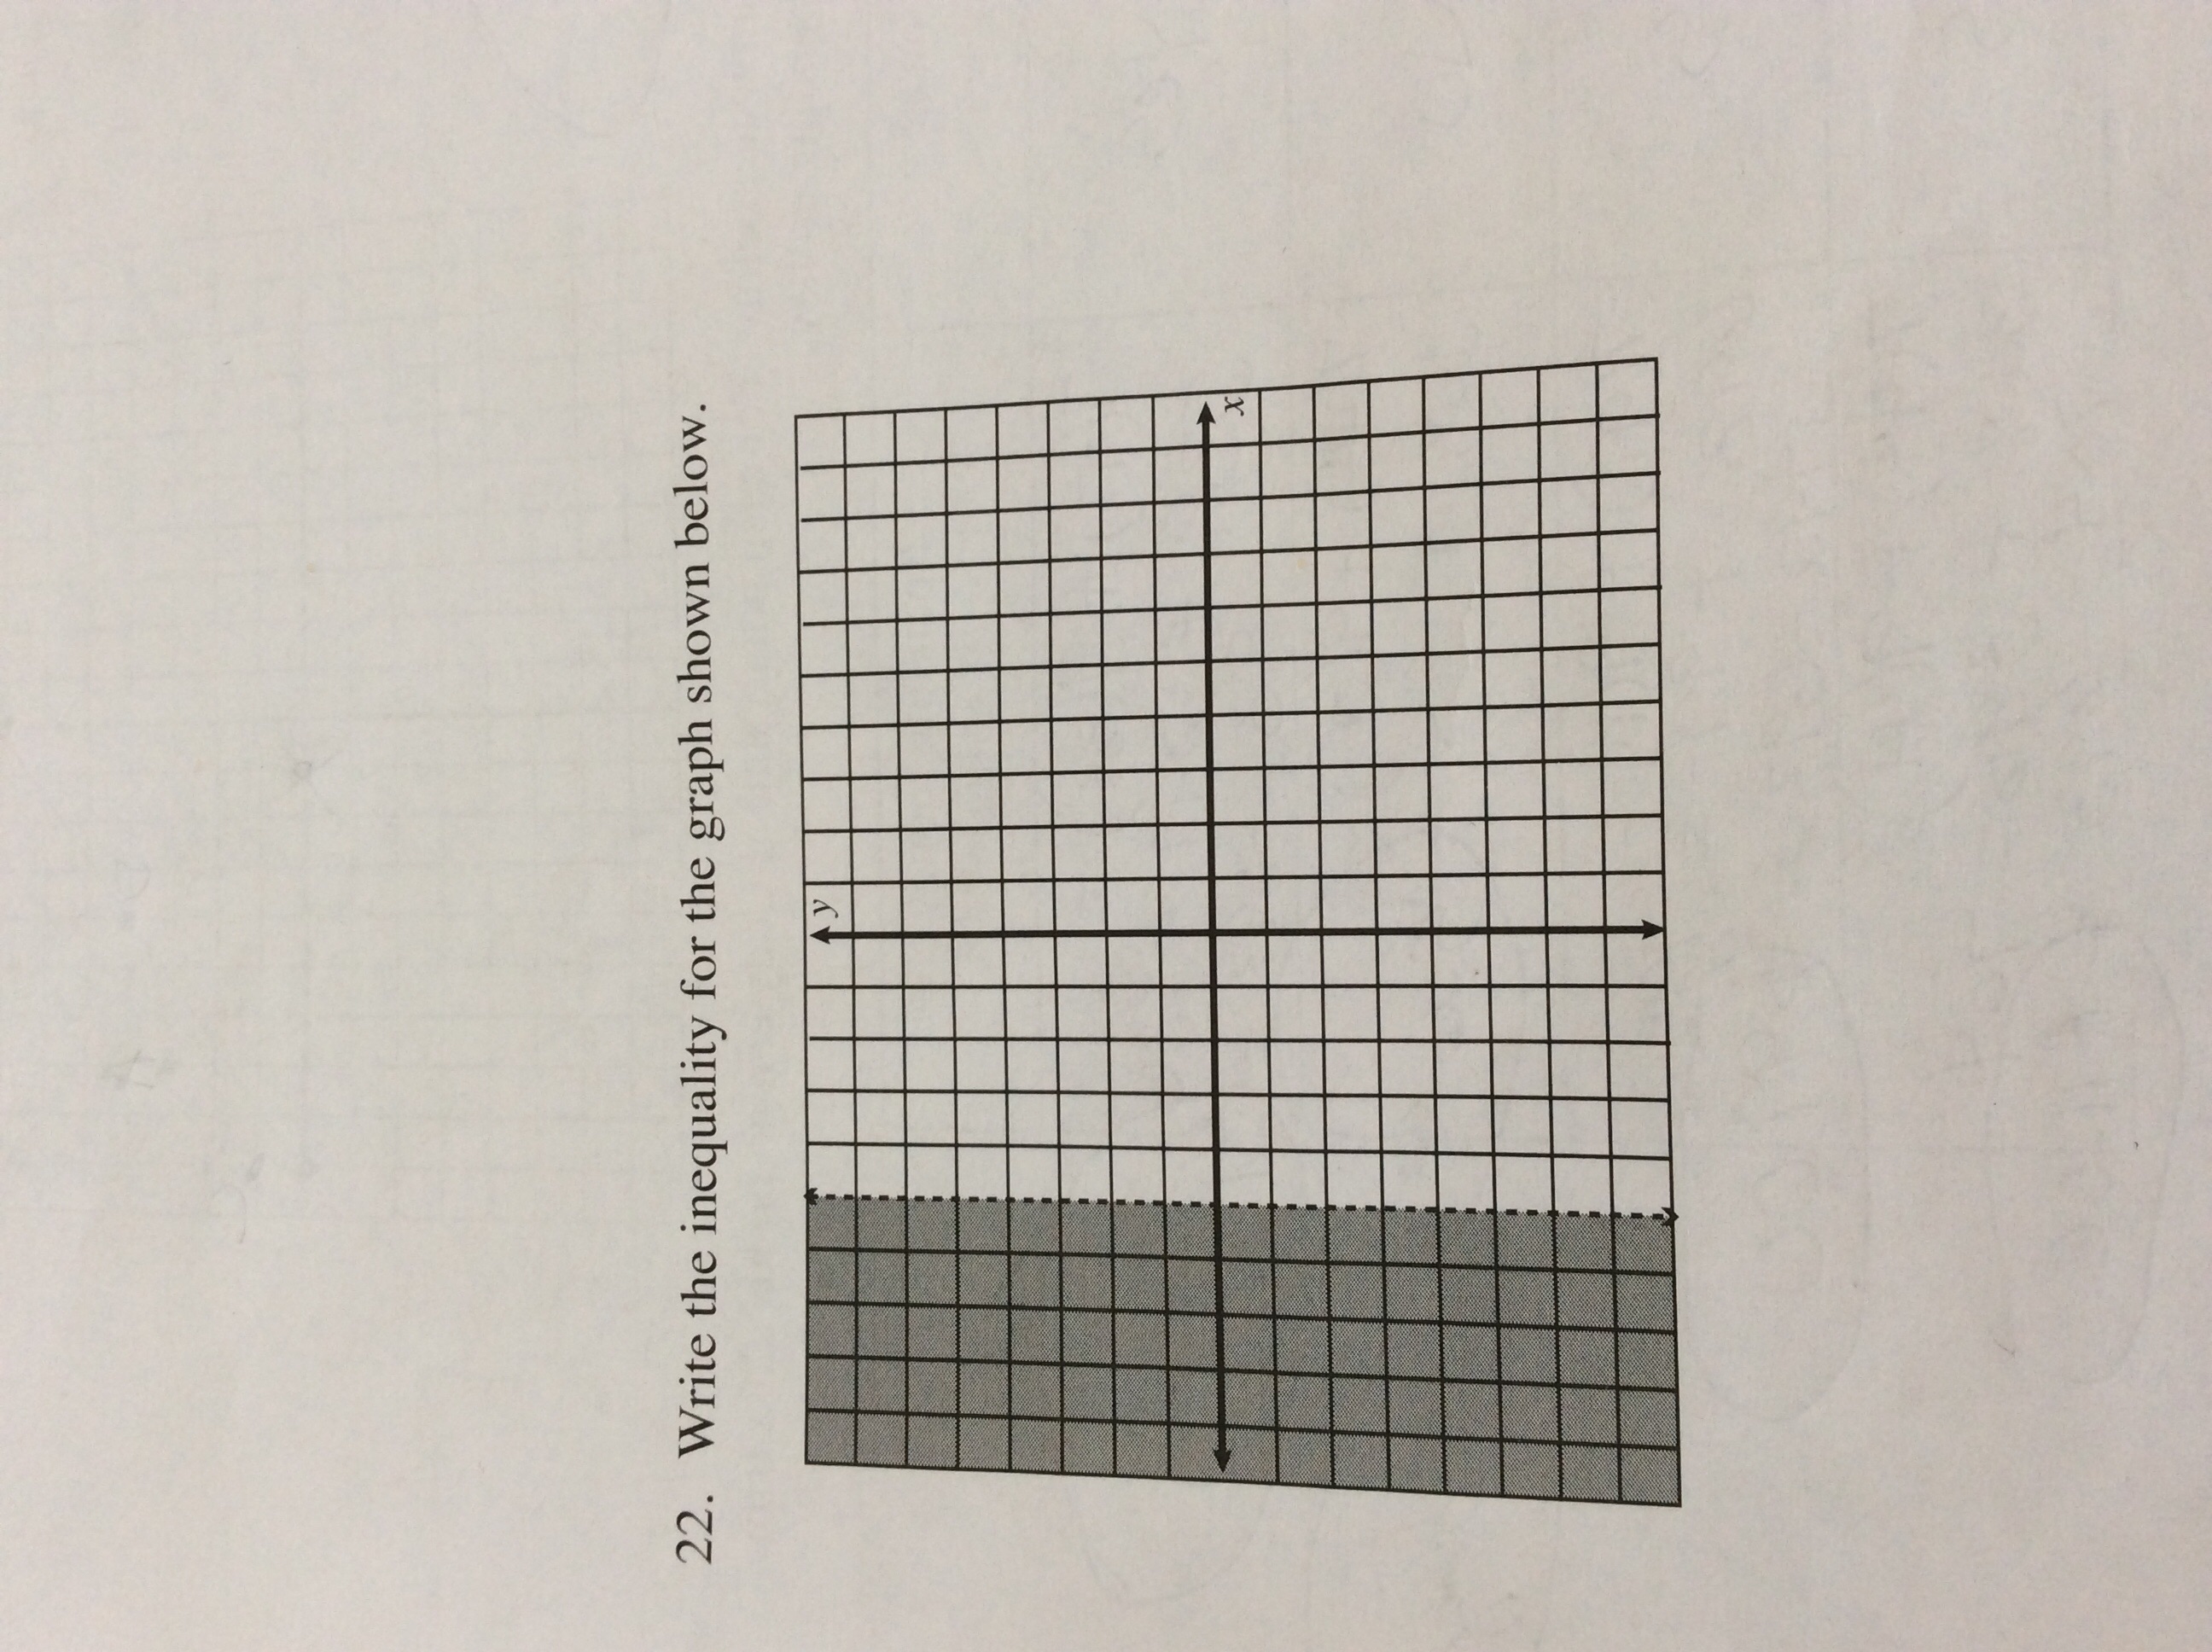
Let's find the equation first. This is a straight line, where every value of y is
graph{y = -5x/x}
Now we need to find out of the sign is
Since the line is dashed, the sign in either
The shaded area shows values greater than
So our inequality is
