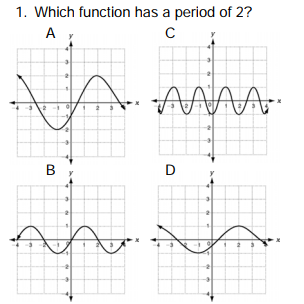
Help please?
1 Answer

According to chegg :
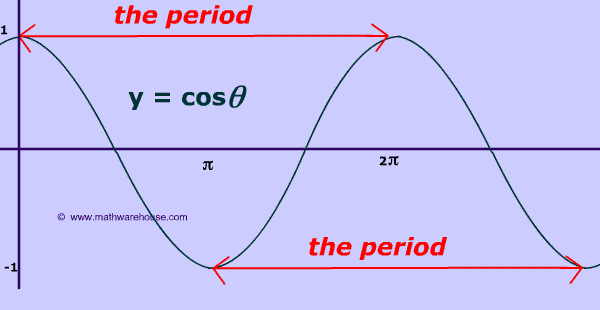
The amplitude and period of a sinusoidal function represent the height and cycle length of a curve, respectively, which are important characteristics of the waveform. Amplitude is the height from the mean, or rest, value of the function to its maximum or minimum. The period is the distance required for the function to complete one full cycle.
And since a full cycle is from peak to peak:
Then we just need to look at which graph has
