What is the central limit theorem?
2 Answers

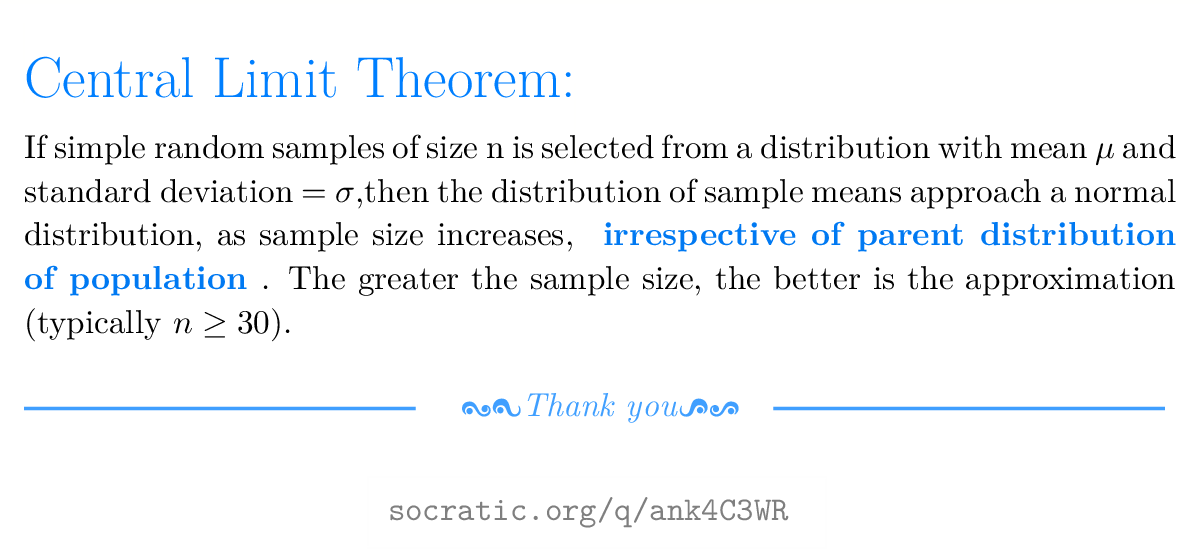
The central limit theorem makes rigorous the intuitive idea that estimates of the mean (estimated from some sample) of some measurement associated with some population improve as the size of the sample increases.
Explanation:
Imagine a forest containing 100 trees.
Now imagine that (rather unrealistically) that, measured in metres, one quarter of them have a height of 2, one quarter of them have a height of 3, one quarter of them have a height of 4, and one quarter of them have a height of 5.
Imagine measuring the height of every tree in the forest, and using the information to construct a histogram with suitably chosen bin sizes (eg 1.5 to 2.5, 2.5 to 3.5, 3.5 to 4.5, and 5.5 to 6.5; I realise that I have not specified the bin to which the boundaries belong but it does not matter here).
You could use the histogram to estimate the probability distribution of the trees. Clearly, it would not be a normal one. In fact, providing the end points were chosen appropriately, it would be a uniform one because there would be equal number of trees corresponding to one of the specified heights in every bin.
Now imagine going into the forest and measuring the height of just two trees; calculate the mean height of these two trees and make a note of it. Repeat that operation several times, so that you would have a collection of the mean values for samples of size 2. If you were to plot a histogram of the estimates of the mean, it would no longer be uniform. Instead, in is likely that there would be more measurements (estimates of the mean based on samples of size 2) near the overall mean height of all of the trees in the forest (in this particular case,
As there would be more estimates of the mean near the true population mean (which is known in this unrealistic example), than far from the mean, the shape of this new histogram would be closer to a normal distribution (with a peak near the mean).
Now imagine going into the forest and repeating the exercise except that you measure the height of 3 trees, calculating the mean in each case, and making a note of it. The histogram that you would construct would have even more estimates of the mean near the true mean, with less spread (the chance of picking three trees in any one sample such that they all come from either of the end groups---either the very tall or the very short---is less than picking three trees with a selection of heights). The shape of your histogram comprising an estimate of the mean size (each mean based on three measurements) would be closer to that of a normal distribution and the corresponding standard deviation (of the estimates of the mean, not of the parent population) would be smaller.
Repeat this for 4, 5, 6, etc, trees per mean, and the histogram that you would construct would look more and more like a normal distribution (with progressively bigger sample sizes), with the mean of the distribution of the estimates of the mean being closer to the true mean, and the standard deviation of the estimates of the mean becoming narrower and narrower.
If you repeat the exercise for the (degenerate) case in which all of the trees are measured (on several occasions, making a note of the mean in every case), then the histogram will have estimates of the mean only in one of the bins (the one corresponding to the true mean), without any variation so that the standard deviation of (the probability distribution estimated from) that "histogram" would be zero.
So, the central limit theorem notes that the mean of the some estimate of the mean of some population asymptotically approaches the true mean, and the standard deviation of the estimate of the mean (rather than the standard deviation of the distribution of the parent population) becomes progressively smaller for larger sample sizes.
