How do you find the volume of region bounded by graphs of #y = x^2# and #y = sqrt x# about the x-axis?

1 Answer
Mar 15, 2018

#color(blue)(pi/3 "cubic units.")#

Explanation:

enter image source here

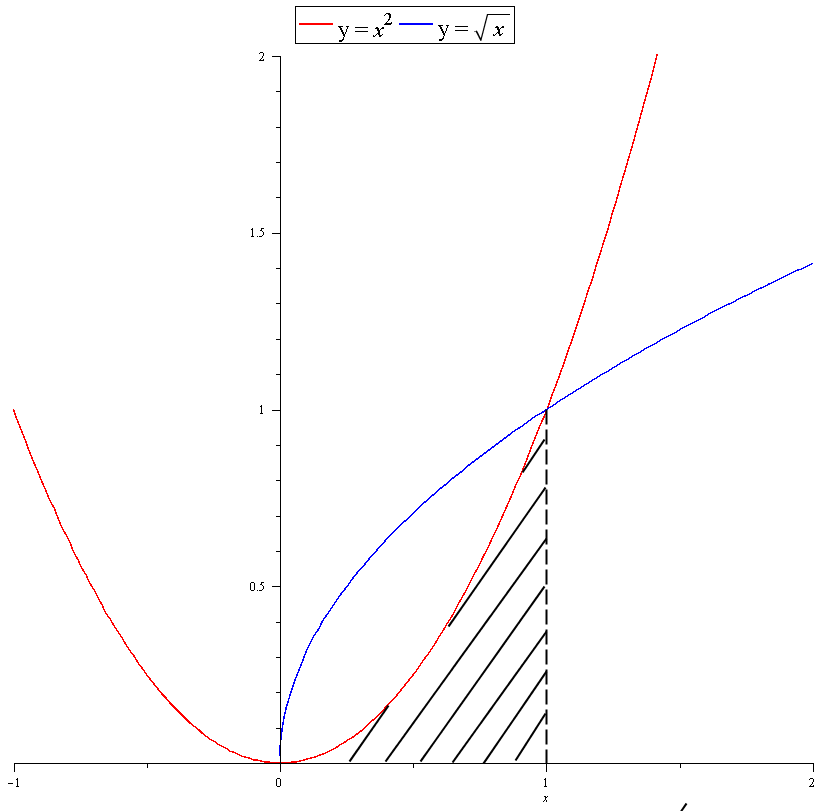
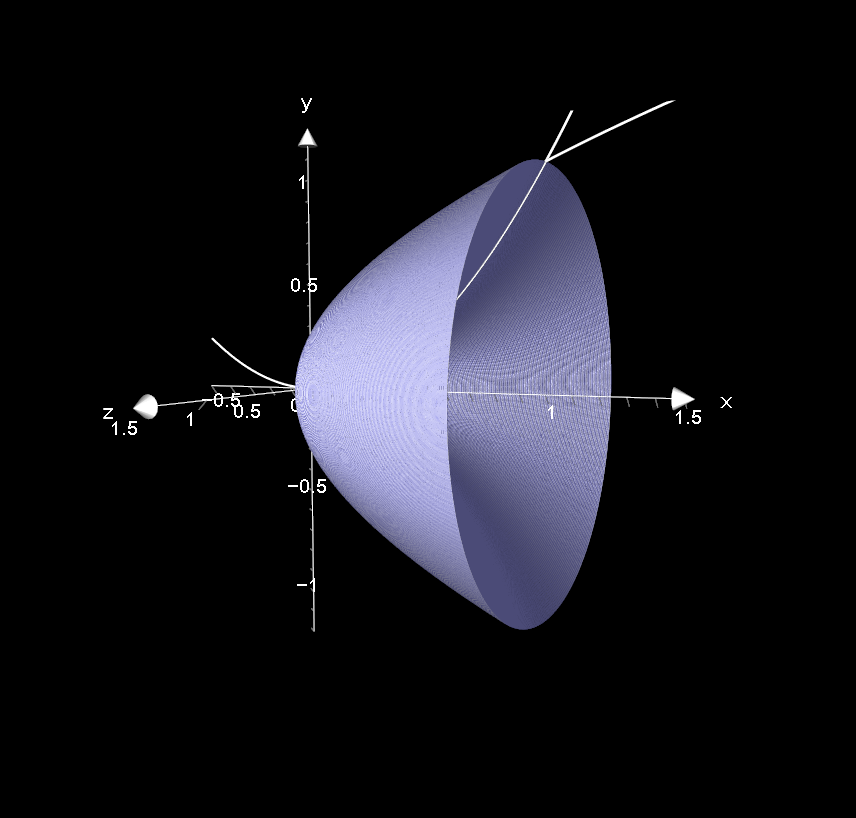
From the graph we can see that the volume we seek is between the two functions. In order to find this, we must find the volume of revolution of #f(x)=sqrt(x)# and subtract the volume of revolution of #f(x)=x^2#. This is shown as the shaded area.

First we need to find the upper and lower bounds. We know the lower bound is #0# since #f(x)=sqrt(x)# is undefined for #x<0#. The upper bound is where the functions intersect:

#:.#

#x^2=sqrt(x)#

#x^2/x^(1/2)=1#

#x^(3/2)=1#

Squaring:

#x^3=1#

#x=root(3)(1)=1#

Volume of #bb(f(x)=sqrt(x))#:

#pi int_(0)^(1)(x^(1/2))=pi[2/3x^(3/2)]_(0)^(1)#

#=pi{[2/3x^(3/2)]^(1)-[2/3x^(3/2)]_(0)}#

Plugging in upper and lower bounds:

#=pi{[2/3(1)^(3/2)]^(1)-[2/3(0)^(3/2)]_(0)}=(2pi)/3# cubic units

Volume of #bb(f(x)=x^2)#

#pi int_(0)^(1)(x^2)=pi[1/3x^3]_(0)^(1)#

#=pi{[[1/3x^3]^(1)-[1/3x^3]_(0)}#

Plugging in upper and lower bounds:

#=pi{[[1/3(1)^3]^(1)-[1/3(0)^3]_(0)}=pi/3# cubic units.

Required volume is:

#(2pi)/3-pi/3=##color(blue)(pi/3 "cubic units.")#

Volume of revolution:

enter image source here