The graph of f(x) = sqrt (16-x^2) is shown below. How do you sketch the graph of the function y = 3f(x)-4 based on that equation (sqrt (16-x^2)?
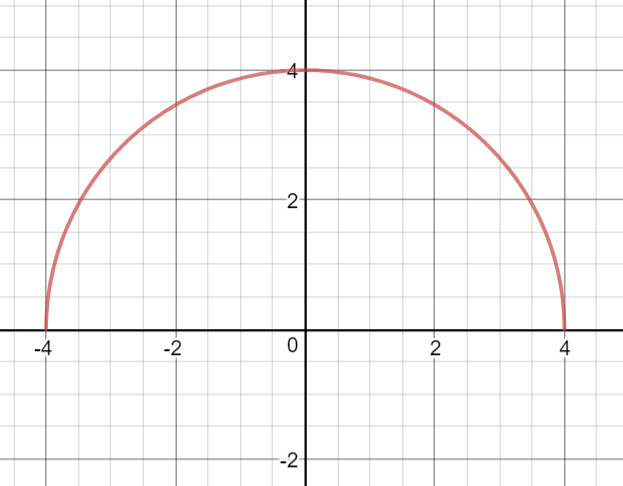
Screenshot from desmos

1 Answer
May 13, 2018

We start with the graph of #y = f(x)#:
graph{sqrt(16-x^2) [-32.6, 32.34, -11.8, 20.7]}
We then will do two different transformations to this graph—a dilation, and a translation.

The 3 next to #f(x)# is a multiplier. It tells you to stretch #f(x)# vertically by a factor of 3. That is, every point on #y = f(x)# gets moved to a point that's 3 times higher. This is called a dilation.

Here's a graph of #y = 3f(x)#:
graph{3sqrt(16-x^2) [-32.6, 32.34, -11.8, 20.7]}

Second: the #-4# tells us to take the graph of #y=3f(x)# and move every point down by 4 units. This is called a translation.

Here is a graph of #y = 3f(x) - 4#:
graph{3sqrt(16-x^2)-4 [-32.6, 32.34, -11.8, 20.7]}


Quick method:

Fill in the following table for a few values of #x#:

#x"   |   "f(x)"   |   "3f(x)-4#
#"———————————"#
#"     |              |"#
#"     |              |"#
#"     |              |"#
#"     |              |"#

Then, plot #x# vs. #3f(x)-4# by plotting their pairs and connecting the dots.