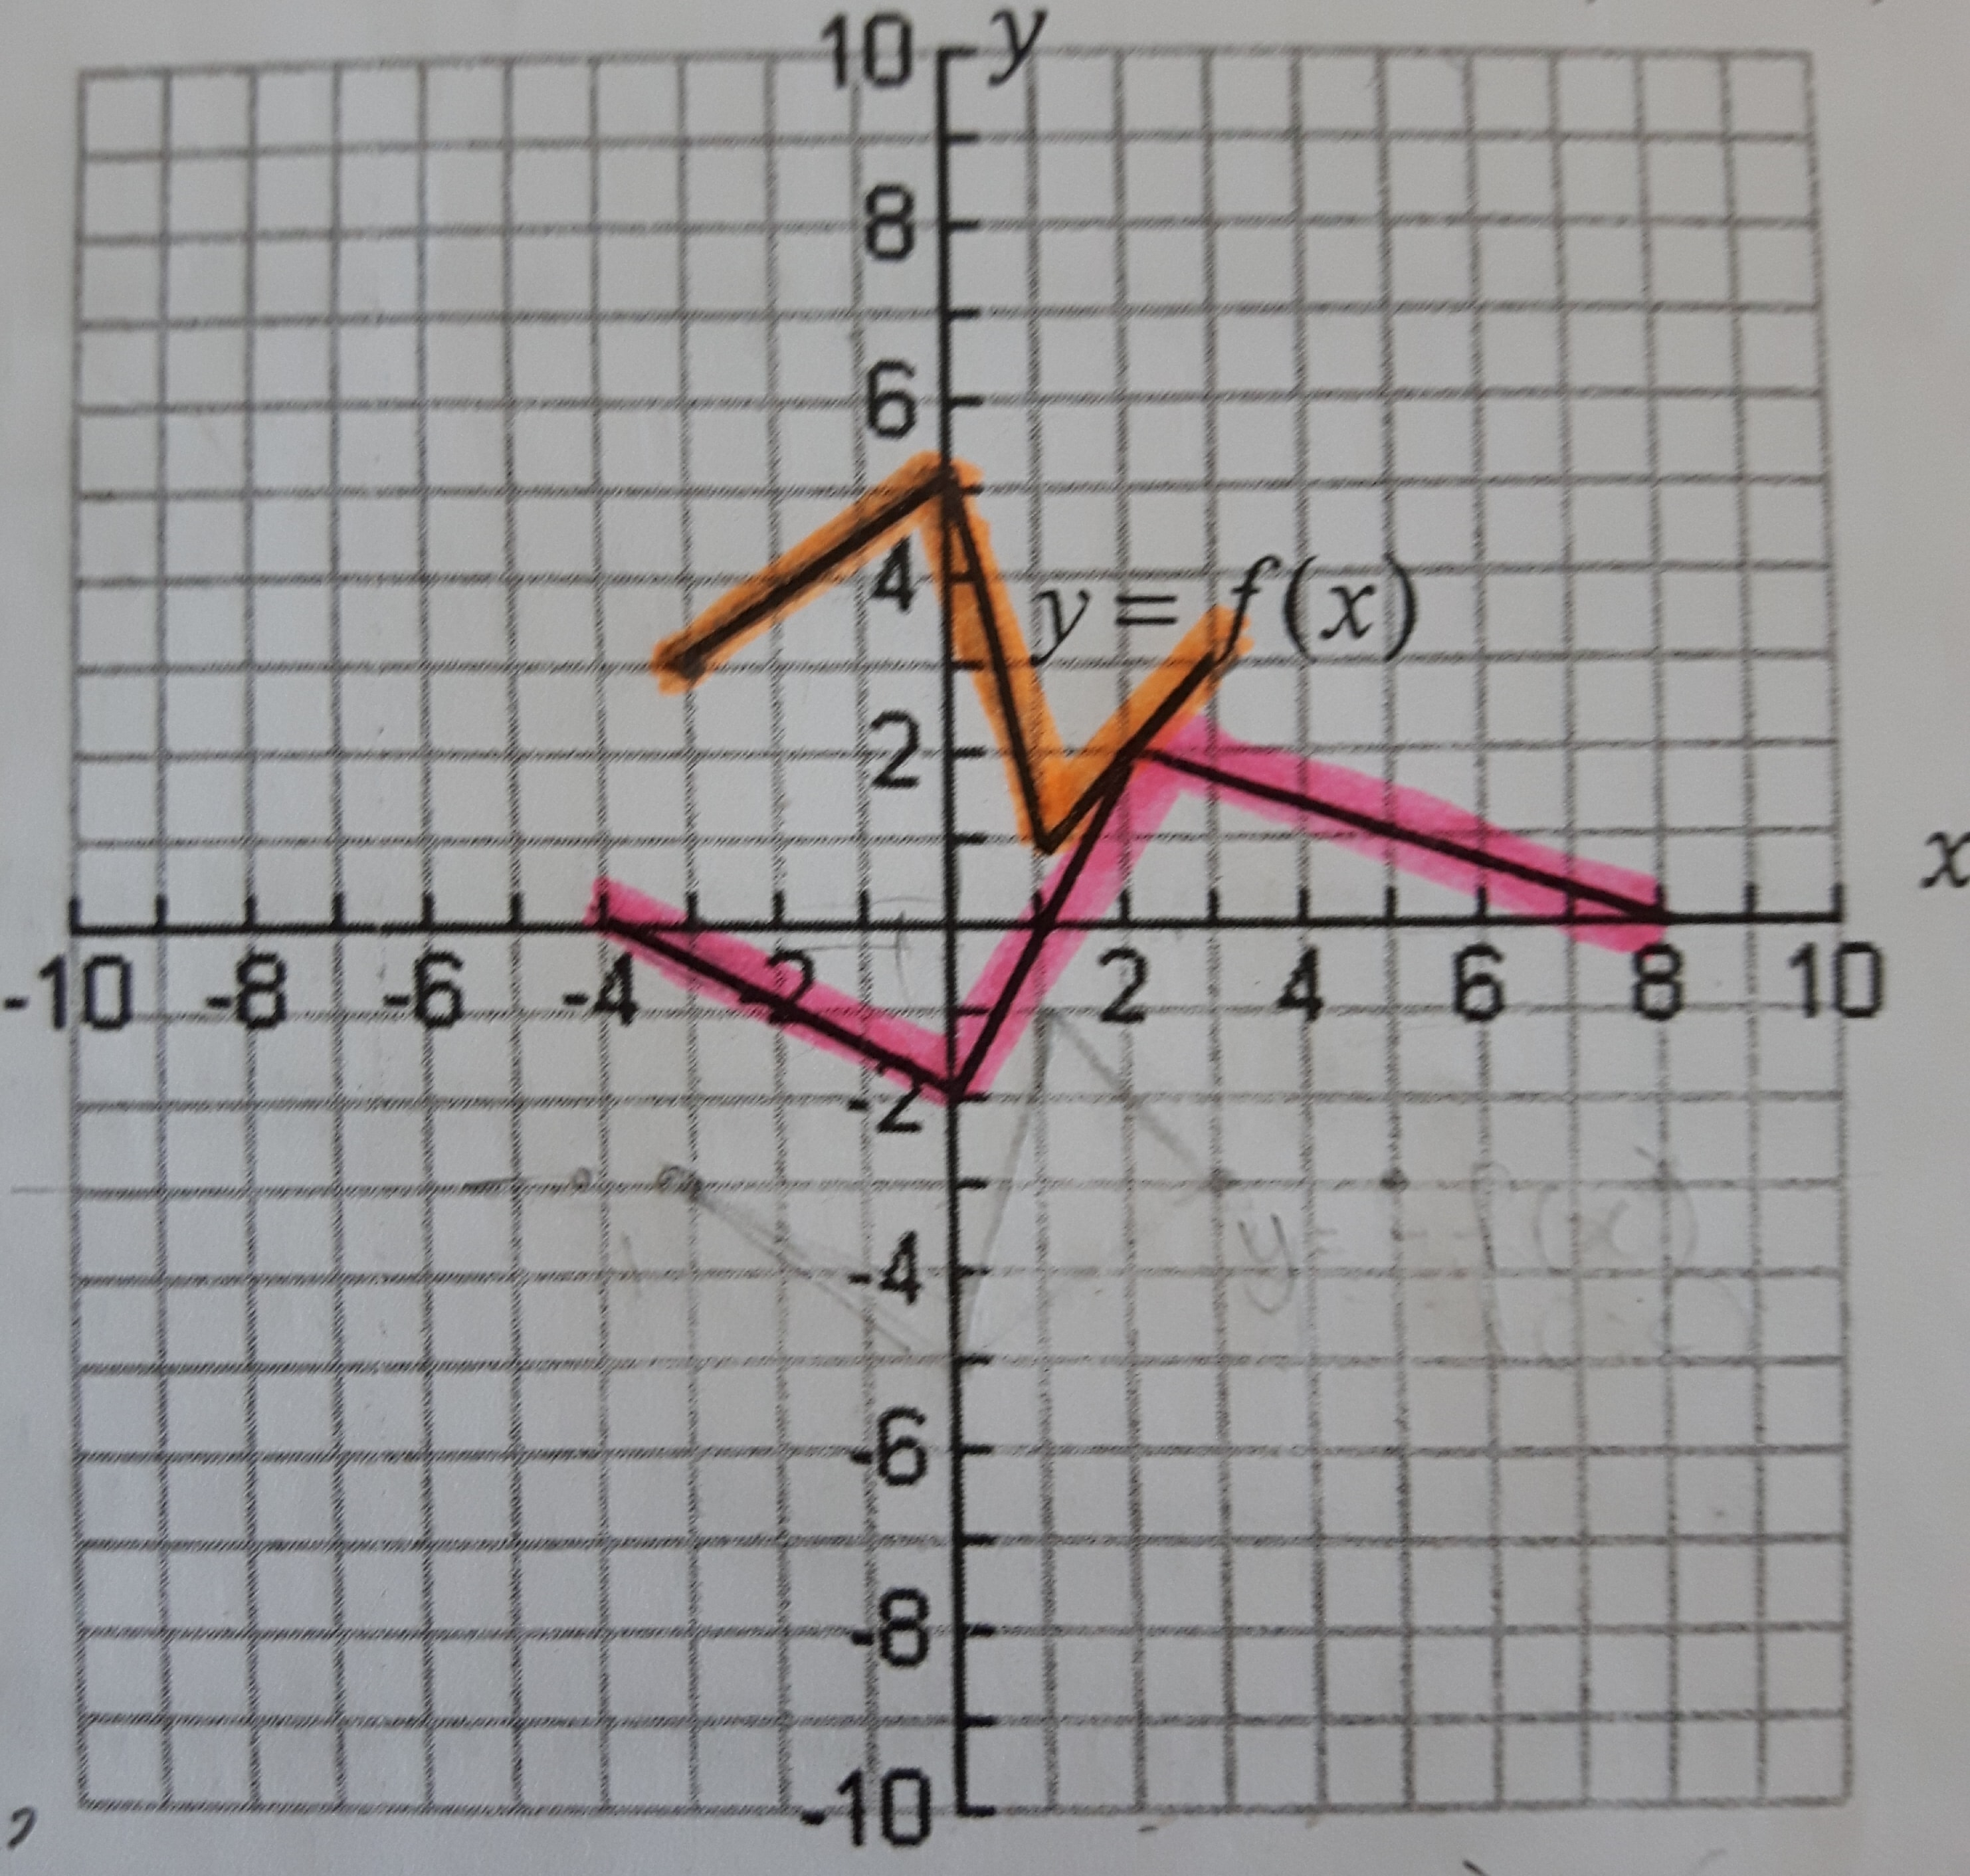
The orange graph is the function f(x). How do you describe the transformations on the pink graph and write an equation for it?
I don't like trial and error method, I would prefer if you can explain another method.
I don't like trial and error method, I would prefer if you can explain another method.
1 Answer

Observe what is the same about the two; also observe what is different. Quantify these differences (put numbers to them).
Picture the transformations you could do to that would enact these differences.
Explanation:
We first observe that the pink graph is wider left-to-right than the orange graph. This means we must have dilated (or stretched) the orange graph horizontally at some point.
We also observe that both the pink and orange graphs have the same height (4 units). This means there was no vertical dilation of the orange graph.
The pink graph is also lower than the orange graph. This means either a vertical translation (aka "shift") or a vertical flip has occurred.
What confused me was how it appeared as though the transformation involved a vertical flip, but I couldn't get that to work, because the line segments in the orange graph have widths of
But then...
I noticed that I could get
I started picturing it. "If we flip
I remembered that horizontal flips and horizontal dilations do not move any point that is on the
Thus, the final transformation can be written as:
#y = f(color(orange)(–)color(blue)(1/2)(x - color(green)2)) - color(magenta)3#
where:
the
#color(orange)(–)# indicates a horizontal flip,
the#color(blue)(1/2)# indicates a left-right stretch by 2,
the#color(green)(-2)# indicates a translation to the right by 2, and
the#color(magenta)(-3)# indicates a translation down by 3.
I wish there were a step-by-step method that would always guarantee success, but sometimes "trial and error" is the only way to make progress on these things. In general, though, try to find stretches and flips first, and then find shifts (as needed).
Again, notice what is the same between the two graphs, and notice what is different. Try to find how to quantify these differences, then put them together to create the total transformation.
Most importantly, never be afraid to make mistakes. To paraphrase inventor Thomas Edison, the "error" in trial-and-error isn't failing; it's successfully finding things that don't work! :D
