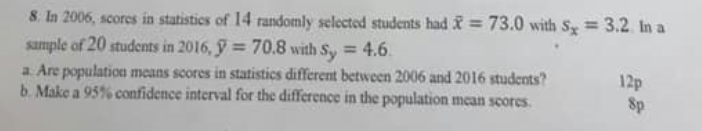
Are population means score in statistics different between 2006 and 2016 students? ( Help ) (Stats)
1 Answer

Part a) No, there is not a significant difference between 2006 and 2016 students' test scores.
Part b) Interval:
Explanation:
Part A
We want to determine whether there is a significant difference between the population mean scores of the students. We will test the hypotheses:
where "y" represents data from 2016, and "x" represents data from 2006.
We can conduct a two-sample t-test for the difference between two means using a significance level
- Random: both samples (2006 and 2016) are random samples
- 10% condition / Independence: We must assume that the population of test takers ...
- in 2006 is greater than 140
N_x >= 10*14 - in 2016 is greater than 200
N_y >= 10*20 - Large/Normal samples: We must assume that the distributions for both populations are each approximately Normal
The formula for the test statistic t is:
with degrees of freedom (using the lower n)
Substitute values:
Now, using the table of t critical values or a calculator, we can find that our
(Using a calculator):
Since our
Part B
We want to construct a 95% confidence interval for the difference between two means.
We can use a two-sample t-interval . The conditions for inference were verified in part (a).
The formula for the two-sample t-interval with 95% confidence is:
Substitute values:
Find t using the table of critical t values (linked above). This is where we specify the 95% confidence.
We are 95% confident that the interval from
