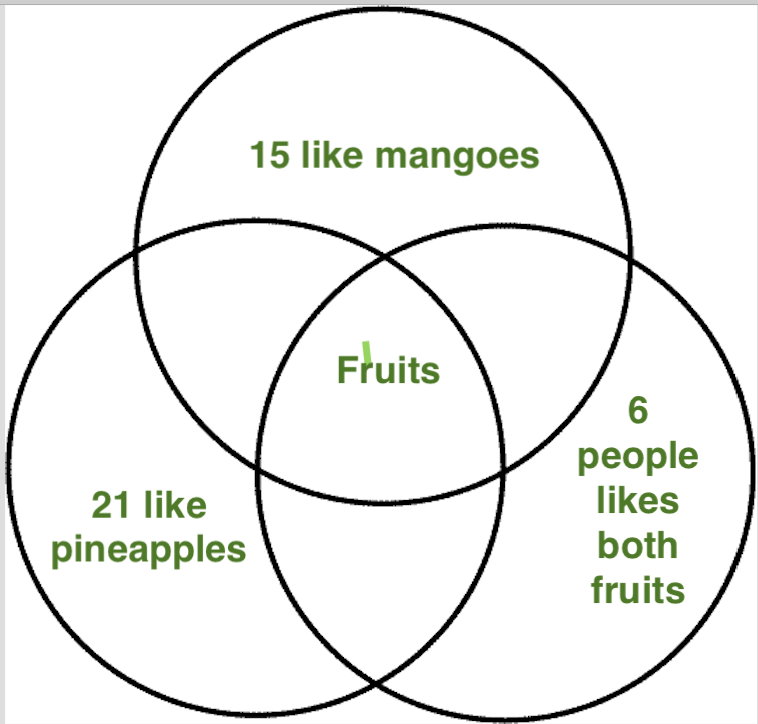
In a class of 40 students, 15 like mangoes ,21 like pineapples and 6 likes the two fruits. 1. Represent the information in a Venn diagram. 2. How many do not like mangoes and pineapples?. 3. What percentage of the class like mangoes only?.
1 Answer

Jun 12, 2018
See below.
Explanation:
- You would draw 3 circles like this:
-
21 people do not like mangoes because if you had 15 like mangoes and 21 like pineapples, people that selected pineapples do not like mangoes. Same goes for pineapple, if 15 people selected mangoes as their favorite, then 15 people do not like pineapples.
-
37.5% people only like mangoes. (Divide
#15/100 = 0.375# then move decimal by 2 places.
