Which graph is the correct answer?
The weight of a radioactive isotope was 96 grams at the start of an experiment. After one hour, the weight of the isotope was half of its initial weight. After two hours, the weight of the isotope was half of its weight the previous hour. If this pattern continues, which of the following graphs represents the weight of the radioactive isotope over time?
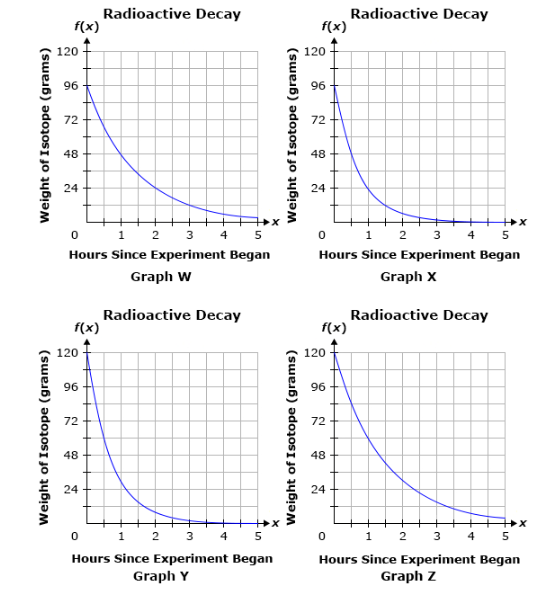
Graph W
Graph X
Graph Y
Graph Z
The weight of a radioactive isotope was 96 grams at the start of an experiment. After one hour, the weight of the isotope was half of its initial weight. After two hours, the weight of the isotope was half of its weight the previous hour. If this pattern continues, which of the following graphs represents the weight of the radioactive isotope over time?
Graph W
Graph X
Graph Y
Graph Z
2 Answers

Graph W
Explanation:
Graph Y and Z are easily ruled out as they start at
This leaves Graph W and Graph X. We know that at hour 1 our substance is half the mass of hour 0. We know it started at
Graph W has

Graph W.
Explanation:
Graphs Y and Z do not start at the correct initial value. Graph X shows a
