How do you graph #\sqrt { x } + y = 8#?
1 Answer

Jun 27, 2018
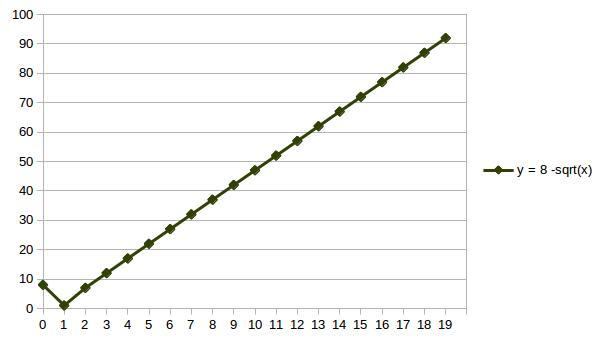
Calculate the desired number of data points, and put them on an appropriate graph paper. Unless you want imaginary values, this expression is undefined for x<0.
Explanation:
ANY graphing or plotting must start with a table of values of the independent variable and the evaluated expression. With those values you may plot them on graph paper manually, or use a computer plotting program.