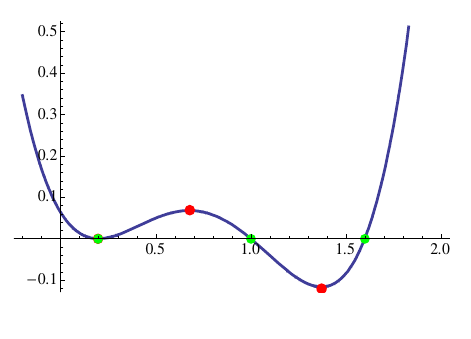
Because #f'(x)>0# , #AA##x##in##(-oo,1)# and #f'(x)>0# #AA##x##in(1.6,2)#
#f# will be strictly increasing in the intervals #(-oo,1]#, #[1.6,2]#
Because #f'(x)<0# , #AA##x##in##(1,1.6)#
#f# will be strictly decreasing in #[1,1.6]#
We can see that #f# has a global maximum at #x_0=1# because
#f# will be increasing in #(-oo,1]# and decreasing in #[1,1.6]# and #f'(1)=0#
Now all that is left so we can draw the graph of #f# is the concavity.
We notice from the graph given that #f'# is decreasing in #(-oo,0.25]#, increasing in #[0.25,0.75]# , decreasing in #[0.75,1.4]# and increasing in #[1.4,2]# which means that #f# will be
concave at #(-oo,0.25]# and #[0.75,1.4]# and convex at #[0.25,0.75]#, #[1.4,2]#
Now we have all that is needed to draw #C_f#.