How would you graph this parabola? #y=(x+1)^2-3#
1 Answer

Jul 13, 2018
Please read the explanation,
Explanation:
We are given the quadratic equation:
Generate a Data table of values as shown below:
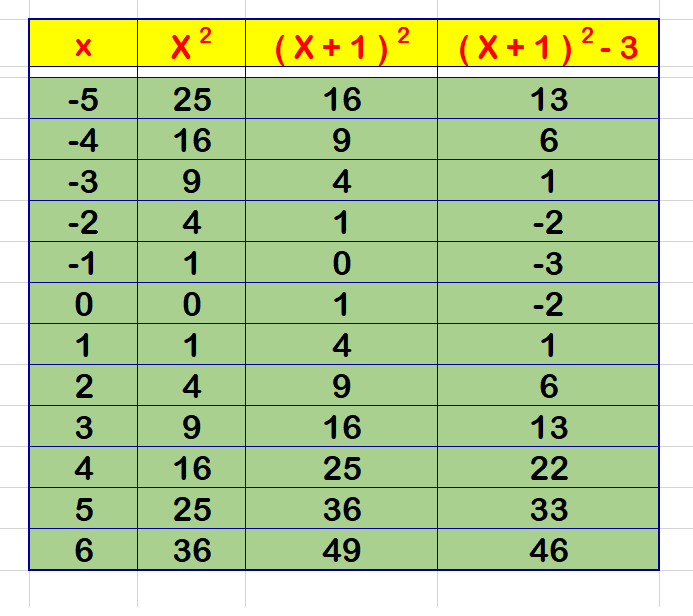
Observing the data table, we can easily see that
Also observe that the quadratic function is in Vertex Form:
We observe that
Hence, Vertex is at :
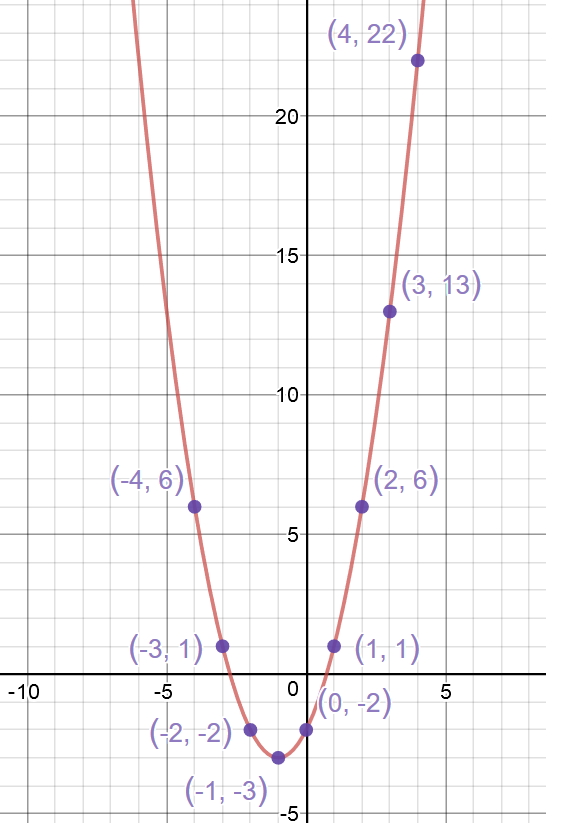
Examine the graph below:
Hope it helps.
