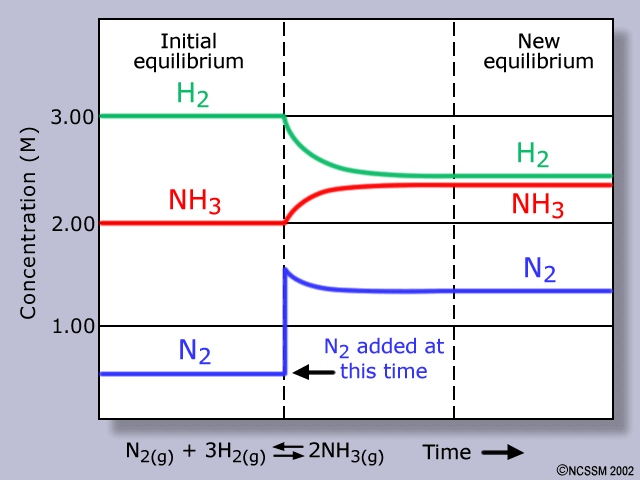
In a closed container, nitrogen gas and hydrogen gas react to produce ammonia. N2(g) + 3H2(g) <--->2NH3(g) Which statement describes the graph of concentration versus time for ammonia as the system approaches dynamic equilibrium?
In a closed container, nitrogen gas and hydrogen gas react to produce ammonia.
N2(g) + 3H2(g) <--->2NH3(g)
Which statement describes the graph of concentration versus time for ammonia as the system approaches dynamic equilibrium?
It curves down and levels out.
It curves up and levels out.
It steadily decreases to zero.
It steadily increases to a maximum.
1 Answer
Jul 20, 2018
Was there not an associated image?
Explanation:
We interrogate the equilibrium....
And given that we assume that there was no ammonia at the commencement of the solution...only the second, and fourth options are goers...

And so I think here

