How do you find the mean, median, and mode of the following frequency distribution table?
Score* (Number of Students)
10 - 6
9 - 13
8 - 12
7 - 11
6 - 13
5 - 5
Score* (Number of Students)
10 - 6
9 - 13
8 - 12
7 - 11
6 - 13
5 - 5
1 Answer

Explanation:
Let us ordering the data from least to greatest.
Please see the table given below.
Let ,
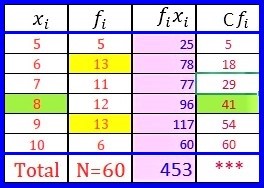
Now ,from
So, see the cell in the green color :
Hence ,
