Graphing Data
Key Questions
-
Answer:
Se explanantion
Explanation:
Consider the equation
#y=mx+c# You can give any value you chose to
#x# and the value of#y# depends on what value you give to#x# So
#y# is the dependant variable and#x# is the independent variable.What you looking for is this: if the independent variable only maps to one value in the dependant variable then the equation/graph is that of a function.
 Tony B
·
1
·
Jun 3 2016
Tony B
·
1
·
Jun 3 2016
-
Well, this is a difficult one! I am not sure this is going to help, but I try anyway.
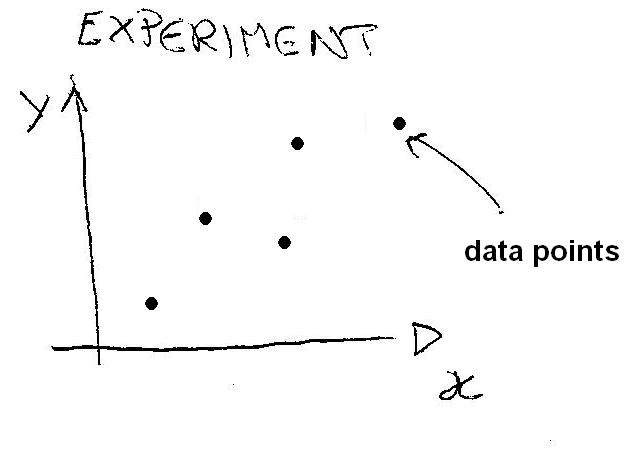
When I have to analyze a phenomenon (I am a physicist...!) I collect data that characterize the phenomenon (for example, I measure the height of a kid each week) and then I plot them.
The result is a graph with points on it that hopefully shows a "tendency".
This can be a linear tendency, for example, so that I can use a line to represent them (the line that "best fit" all the data points).
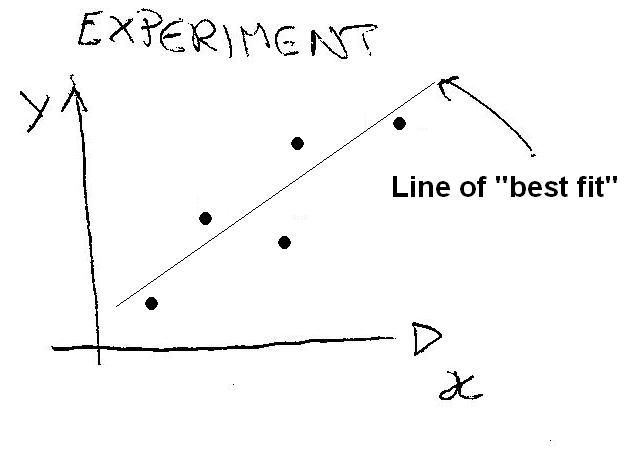
Next I evaluate the equation of the line in the general form:#y=ax+b# Now, even if I do not know what happens for a certain value of the variable
#x# (because I didn't measure it directly) I can put it in the equation of the line and get the corresponding value for#y# .In the example of the height of a kid, I can measure it along, say, a period of 5 weeks, get my graph and evaluate the linear equation as:
#height=2*time+40# in cm for the eight and week for the time (2 will have units of cm/week and 40 of cm).If I want the height of the kid in the 7th week I put time=7 and find the projected height.
Remember:
You can have different curves that fit your data (parabolas. hyperbolae, sinusoidals...);
The fit depends upon the "goodness" of you experiment in the first place. If you try to correlate the height of a kid to the number of red cars you observe ...it won't probably work very well!
(hope it helps!)
 Gió
·
1
·
Dec 20 2014
Gió
·
1
·
Dec 20 2014
-
To visualize it (and eventually, for example, to find out patterns in the data that otherwise would be hard to find).
 Pythagoras
·
3
·
Sep 20 2015
Pythagoras
·
3
·
Sep 20 2015