How do you graph sin(2x-pi/2)?
2 Answers
= 2cos (2x)
Explanation:
Use trig unit circle and property of complement arcs:
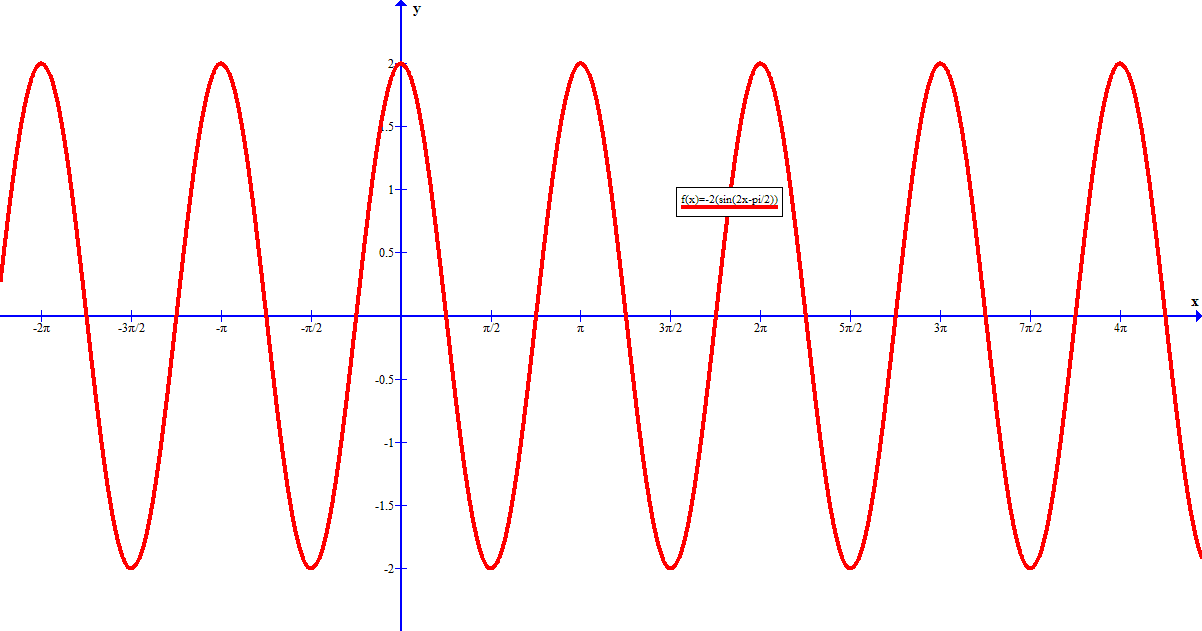
y = - 2sin (2x - pi/2) = 2cos (2x)
See below for step-by-step analysis and graphing
Explanation:
Let's start with the standard
and in particular let's note the basic cycle of the
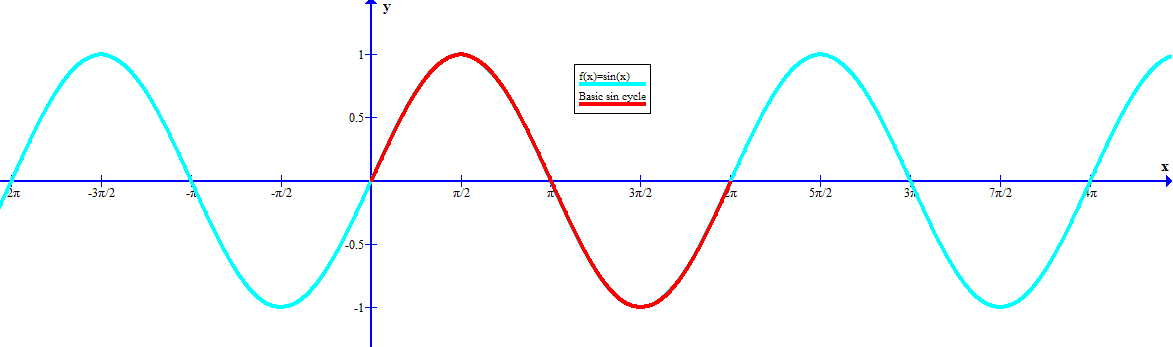
Notice that the argument range for the basic cycle is
Now let's consider what happens with
The basic cycle still requires an argument range of
that is
but for this to be possible,
That is the basic cycle will appear to have shifted to the right by

Next let's consider what happens when we double the value of the variable
The basic cycle still needs an argument range
that is
which, as we have seen, implies
which, to be possible, means

The horizontal distance from the origin on the X-axis seems to have been "squeezed" by a factor of
Finally, what happens to our basic cycle when we multiply the entire expression by
The value of each y-coordinate is scaled by a factor of
(you might think of this as the coordinate is reflected in the X-axis and then stretched by

Of course, this only gives us the basic cycle.
For the full graph this cycle is repeated infinitely in both directions: