(a) Data
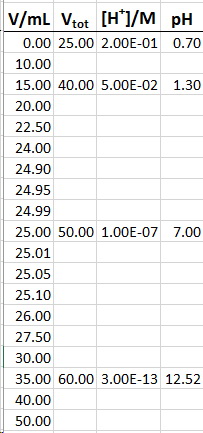
Here are sample calculations for 15.00 mL (before the equivalence point) and 25.00 mL of #"NaOH"# (after the equivalence point) added.
You can use them as models for calculating the pH at other volumes.
(i) At 15.00 mL
#"Initial moles of HCl" = "0.025 00" color(red)(cancel(color(black)("dm"^3))) × "0.20 mol"/(1 color(red)(cancel(color(black)("dm"^3)))) = 5.0 × 10^"-3" color(white)(l)"mol"#
#"Moles of NaOH added" = "0.015 00" color(red)(cancel(color(black)("dm"^3))) × "0.20 mol"/(1 color(red)(cancel(color(black)("dm"^3)))) = 3.0 × 10^"-3" color(white)(l)"mol"#
#"Moles of HCl reacted" = "moles of NaOH added" = 3.0 × 10^"-3"color(white)(l) "mol"#
#"Moles of HCl remaining" = 5.0 × 10^"-3"color(white)(l) "mol" -3.0 × 10^"-3"color(white)(l) "mol" = 2.00 × 10^"-3"color(white)(l)"mol"#
#"Total volume" = "0.040 00"color(white)(l) "dm"^3"#
#["H"_3"O"^"+"] = (2.0 × 10^"-3"color(white)(l) "mol")/("0.040 00 dm"^3) = 5.0 × 10^"-2"color(white)(l) "mol/dm"^3#
#"pH" = "-"log["H"_3"O"^"+"] = "-"log(5.0 × 10^"-2") = 1.30#
(ii) At 35.00 mL
At this point, you have excess #"NaOH"#.
#"Moles of NaOH added" = "0.035 00" color(red)(cancel(color(black)("dm"^3 color(white)(l)"NaOH"))) × "0.20 mol NaOH"/(1 color(red)(cancel(color(black)("dm"^3color(white)(l) "NaOH"))))#
#= 7.0 × 10^"-3" color(white)(l)"mol NaOH"#
#"Moles of NaOH reacted" = "Initial moles of HCl" = 5.0 × 10^"-3"color(white)(l) "mol"#
#"Moles of NaOH remaining" = 7.0 × 10^"-3"color(white)(l) "mol" color(white)(l)– 5.0 × 10^"-3"color(white)(l) "mol" = 2.0 × 10^"-3" color(white)(l)"mol"#
#"Total volume = 0.060 dm"^3#
#["OH"^"-"] = (2.0 × 10^"-3"color(white)(l) "mol")/("0.060 dm"^3) = 3.33 × 10^"-2" color(white)(l)"mol/dm"^3#
#["H"_3"O"^"+"] = K_text(w)/(["OH"^"-"]) = (1.00 × 10^"-14")/(3.33 × 10^"-2")color(white)(l) "mol/dm"^3 = 3.00 × 10^"-13"color(white)(l) "mol/dm"^3#
#"pH" = "-"log(3.00 × 10^"-13") = 12.52"#
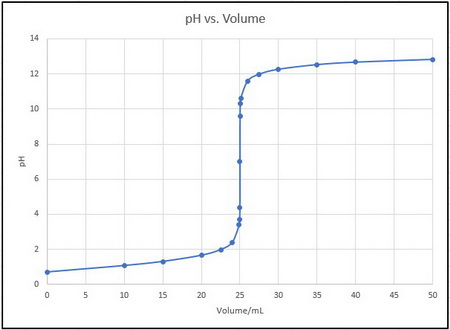
b. Titration curve
Your titration curve should look like the one below (I added a few extra points between 20 mL and 30 mL to get a smoother curve where the pH is changing rapidly).