Question #d7048
1 Answer

Explained below
Explanation:
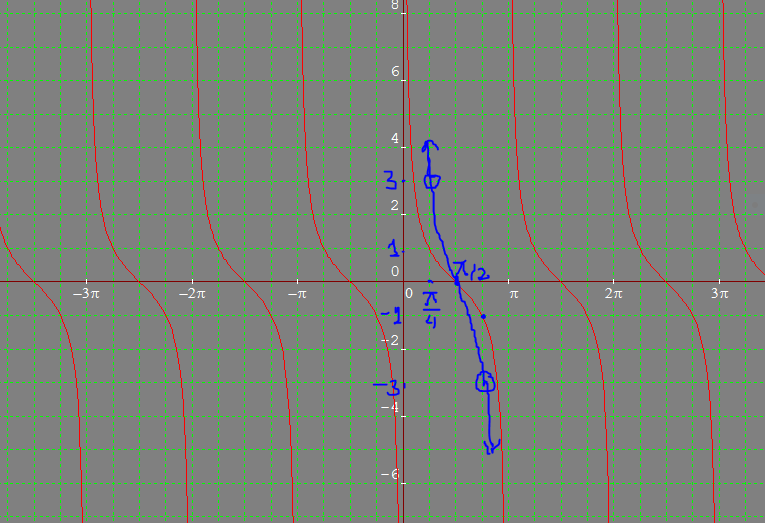
The graph of y= 3 cot x +2, can be drawn, first , by vertical stretch of the graph of y= cot x by a factor of 3 and then horizontal shift to the right by 2 units.
The vertical stretch has been explained in the attached figure. The red outlines are for the graph of cot x, with vertical asymptotes at x=0,
At point x=(pi/2), cot x =0, hence this point would remain where it is.
Next at point x=
Asymptotes at x=0 and x=
The vertical stretch of the graph of cot x, from x=0 to x=
Having stretched the graph, this can be shifted 2 units to the right to have the desired graph.