Question #50172
1 Answer

See below
Explanation:
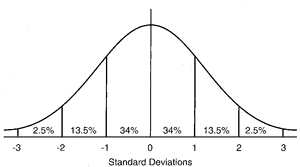
At first you must know the values and calculate its standard deviation that are presented in figure on the normal distribution. From more sensible diagrams or tables you can see that under -3,0 you find the 013% of the values while under -0,5 you find the 30,85 % of the value, then in your range you find
 img.tfd.com
http://www.proposalsheet.com/bell-curve-percentages/
 f.hypotheses.org
http://freakonometrics.hypotheses.org/9404
