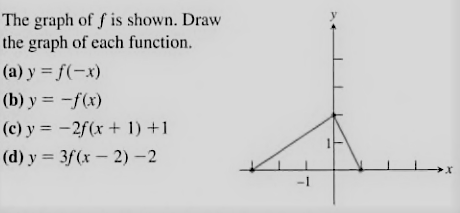
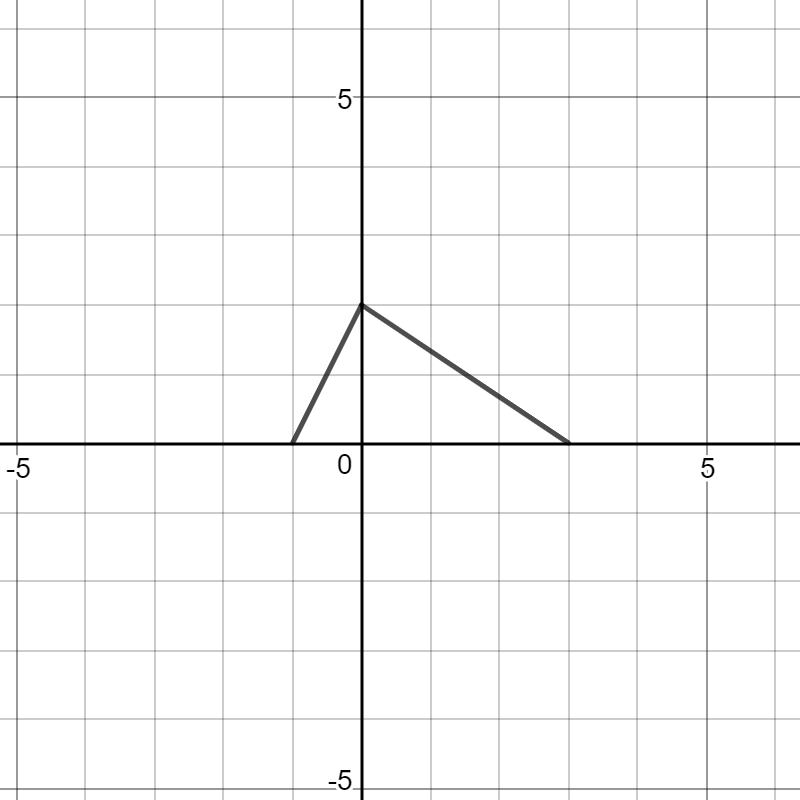
Draw the graph of the functions listed below?
2 Answers

Aug 10, 2017
Please see below.
Explanation:
(a) replace
(b) replace
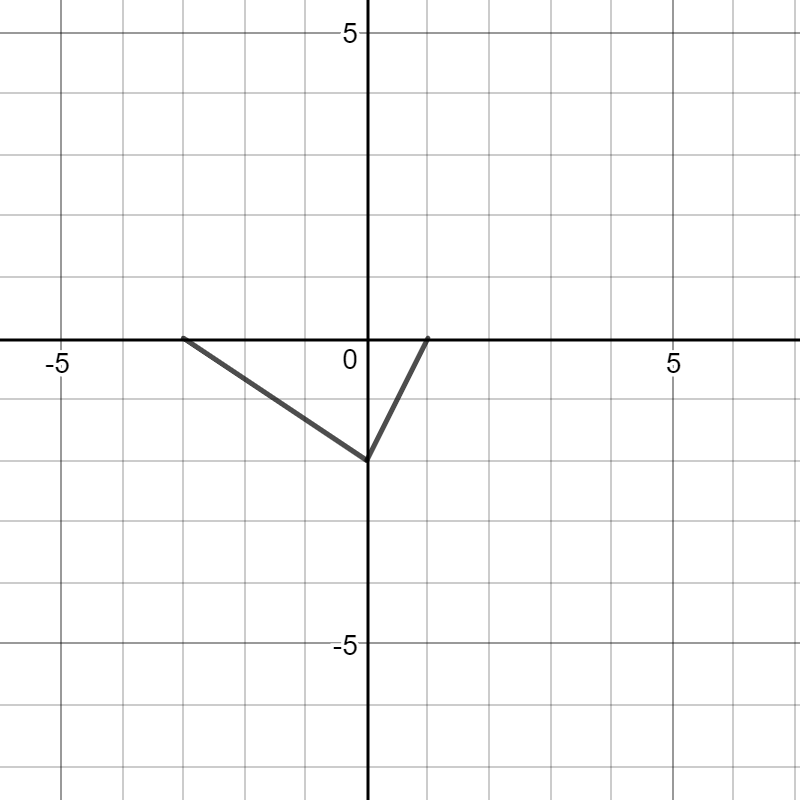

Aug 10, 2017
- A negative sign in front of the function means it is flipped vertically, since the function is really
#y = f(x)# . - A constant in front of a function scales it vertically by a factor of that constant.
- If the argument,
#x# , in#f(x)# , has#+h# , where#h# is a constant, the function is shifted horizontally by#-h# units. So, the function is shifted in the opposite horizontal direction suggested by the sign of#h# . - If the function has
#k# added to it outside of parentheses, where#k# is a constant, the function is shifted vertically by#k# units.
So,

Similarly,

