How are box-and-whisker plots used to display data?
1 Answer
May 3, 2018
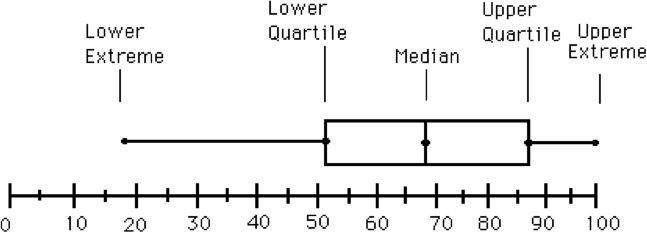
Box-and-whisker plots show five data points, providing a reasonable visual of a data set's skewness, symmetry, and spread.
Explanation:
The following are the five measures shown by this chart.
- The Lower Extreme
This is the lowest data point in the set. - The Lower Quartile
This is the median of the lower half of the data. - The Median
This is the middle value of the data set. In other words, it is the value with the same number of terms below and above it that splits the set in half. - The Upper Quartile
This is the median of the upper half of the data. - The Upper Extreme
This is the greatest value in the data set.
Here is an example of a box-and-whisker plot.
 WebQuest

