Box-and-Whisker Plots
Key Questions
-
Answer:
Look for key points The middle of the box the edges of the box and the points that form the whiskers.
Explanation:
The middle of the box is the middle of the data or the medium
The box holds 50% of the data. the edges of the box are high and low mediums. The whiskers are the high and low extremes data points.David Drayer · 1 · Aug 4 2018
-
Answer:
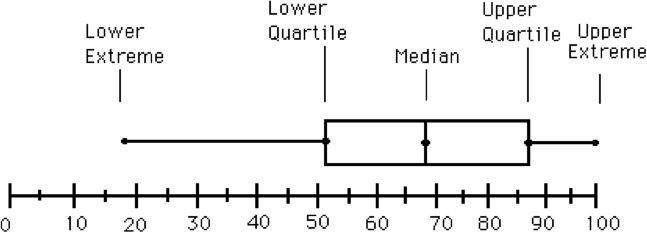
Box-and-whisker plots show five data points, providing a reasonable visual of a data set's skewness, symmetry, and spread.
Explanation:
The following are the five measures shown by this chart.
- The Lower Extreme
This is the lowest data point in the set. - The Lower Quartile
This is the median of the lower half of the data. - The Median
This is the middle value of the data set. In other words, it is the value with the same number of terms below and above it that splits the set in half. - The Upper Quartile
This is the median of the upper half of the data. - The Upper Extreme
This is the greatest value in the data set.
Here is an example of a box-and-whisker plot.
 Emily
·
1
·
May 3 2018
Emily
·
1
·
May 3 2018
- The Lower Extreme
-
Box-and-whisker plots are useful for displaying data. It shows the five-number summary, which contains the minimum, first quartile, median, third quartile, and maximum.
Outliers are also placed on the box-and-whisker plot.
Here is an example of a box-and-whisker plot:

Hope this helps!
 Shantelle
·
1
·
Aug 5 2018
Shantelle
·
1
·
Aug 5 2018
-
Answer:
A box-and-whisker plot is a type of graph that has statistics from a five-number summary.
Explanation:
Here's an example:
The five-number summary consists of:
- Minumum: lowest value/observation
- Lower quartile or Q1: "median" of the lower half of data; lies at 25% of data
- Median: middle value/observation
- Higher quartile or Q3: "median" of the upper half of data; lies at 75% of data
- Maximum: highest value/observation
The interquartile range (IQR) is the range of the lower quartile (Q1) and upper quartile (Q2).
Sometimes, there are also outliers. Outliers occur when outside the range of
#Q1-1.5(IQR)# or#Q3+1.5(IQR)# .If an outlier occurs, it is graphed on the box-and-whisker plot as a dot. For example, the outlier here is at the data value
#95# :

NOTE : An outlier is not a minimum or maximum. If an outlier is the lowest point, then the 2nd lowest point will become the minimum. If an outlier is the highest point, then the 2nd highest point will become the maximum.
Hope this helps!
Shantelle
·
1
·
Jul 28 2018
Questions
Radicals and Geometry Connections
-
Graphs of Square Root Functions
-
Simplification of Radical Expressions
-
Addition and Subtraction of Radicals
-
Multiplication and Division of Radicals
-
Radical Equations
-
Pythagorean Theorem and its Converse
-
Distance Formula
-
Midpoint Formula
-
Measures of Central Tendency and Dispersion
-
Stem-and-Leaf Plots
-
Box-and-Whisker Plots