How are vector diagrams used?
1 Answer

Vector diagrams are used to combine multiple vector quantities into a single resultant, or to decompose a vector into constituent portions.
Explanation:
Vectors are used to represent quantities with magnitude and direction, like forces or velocities. Vector diagrams are graphical representations of vector quantities using arrows to represent the vector.
 http://www.cyberphysics.co.uk/topics/forces/vectors.htm
The length of the arrow represents the magnitude and the angle the direction. The longer the arrow, the higher the magnitude, on some scale. The scale is what you decide it should be, for instance, how many centimeters on your graph represents how much of your vector quantity. For example, if you were working with velocity, you may decide that 1 cm on your graph equals 1 m/s of velocity.
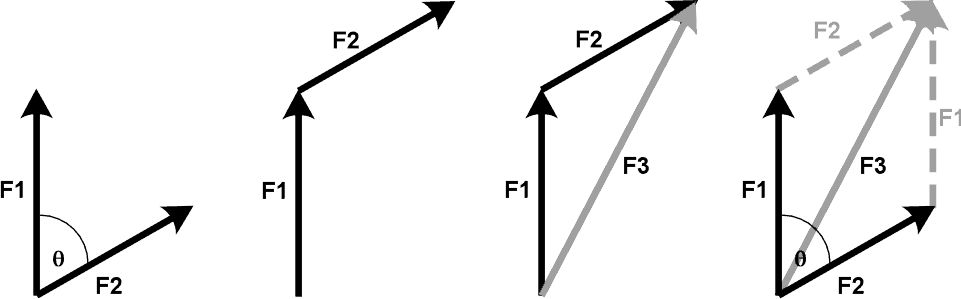
Adding two vectors together is as easy as stacking them end-to-end on the diagram and drawing the resultant vector from the origin to the end of the final vector. In the following example, F1 and F2 are added together to form F3 (two methods are shown).
 http://physicslearning2.colorado.edu/pira/index.php?option=com_content&view=article&id=15&Itemid=176
Getting the components of a vector is like addition in reverse. You are trying to find two (or more) vectors that add up to the first vector. Usually this is because we are trying to find the components along specific axes, like
 http://www.cyberphysics.co.uk/topics/forces/vectors.htm
