How can the average rate of change be interpreted from a graph or a function?
2 Answers

Oct 19, 2015
The rate of change is the slope of the graph.
Explanation:
It really doesn't make much sense to try to apply this to nonlinear functions, and you certainly cannot apply an "average" value to a non-linear function unless you first linearize it. Even then, the interpretation of what that "average" means must be carefully understood.

Oct 15, 2017
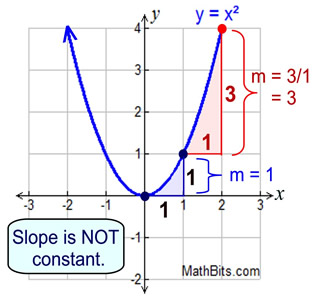
When working with non-linear functions, the average rate of change is not constant.
When working with non-linear functions, the average rate of change is not constant.
Explanation:
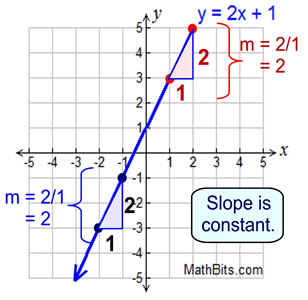
When working with linear functions, average rate of change is constant.
When working with non-linear functions, the average rate of change is not constant.