How do I graph the given function?
1 Answer

Feb 21, 2018
Belongs to the category of straight line whose standard form is
Explanation:
A straight line has the equation
where c = intercept made by line on y axis.
m= slope of the line.
Graph of
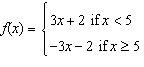
(i) 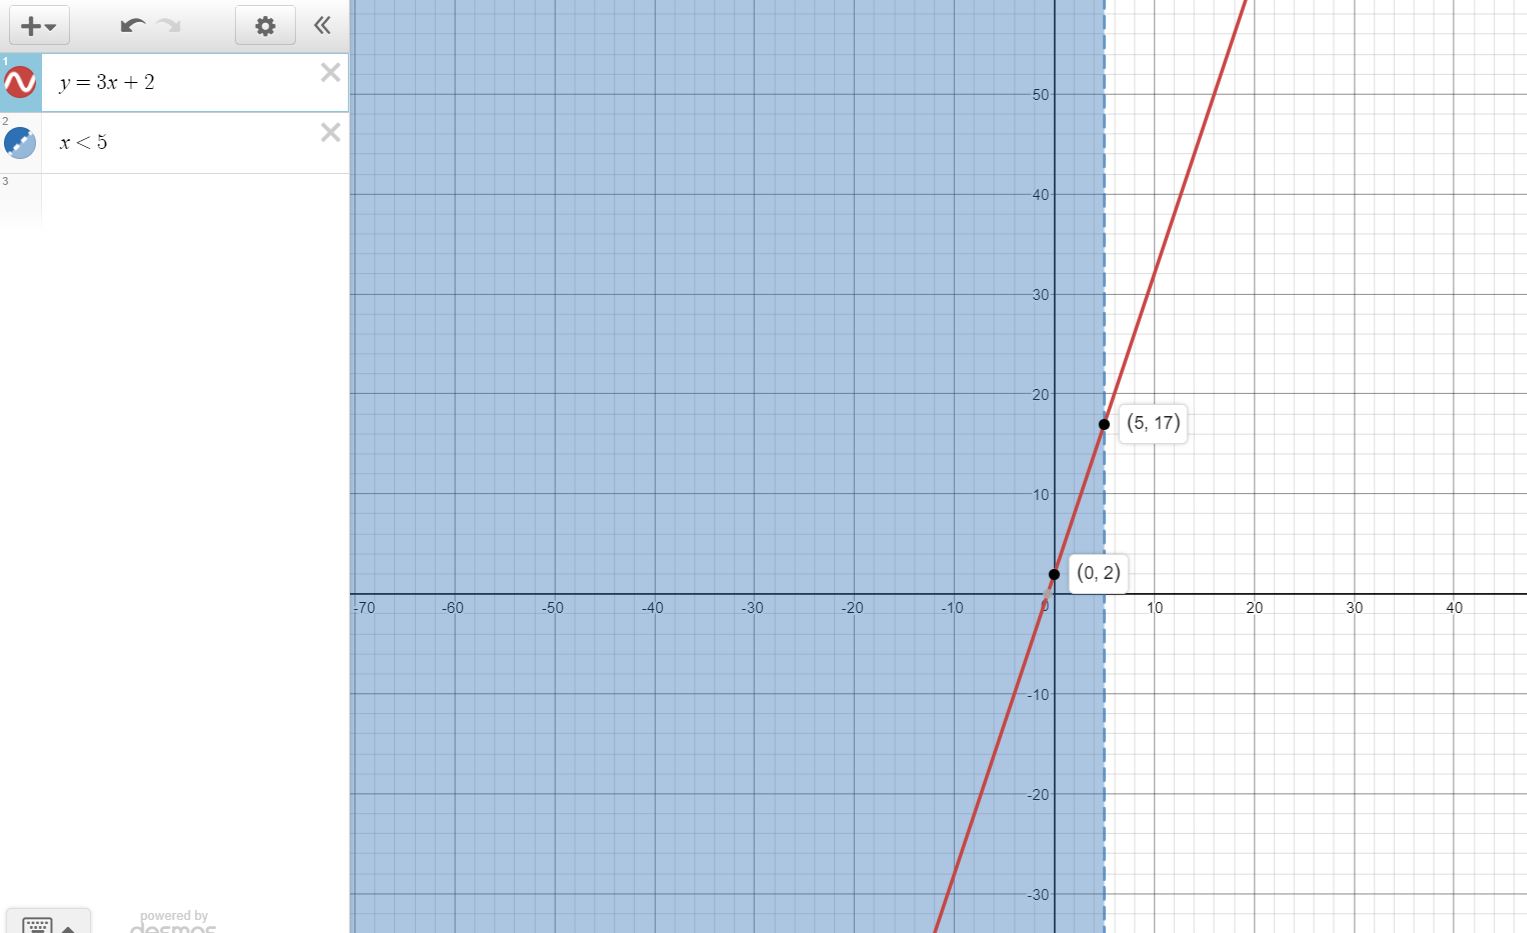
Blue region indicates the required region.
(ii) 
Blue region indicates the required region.
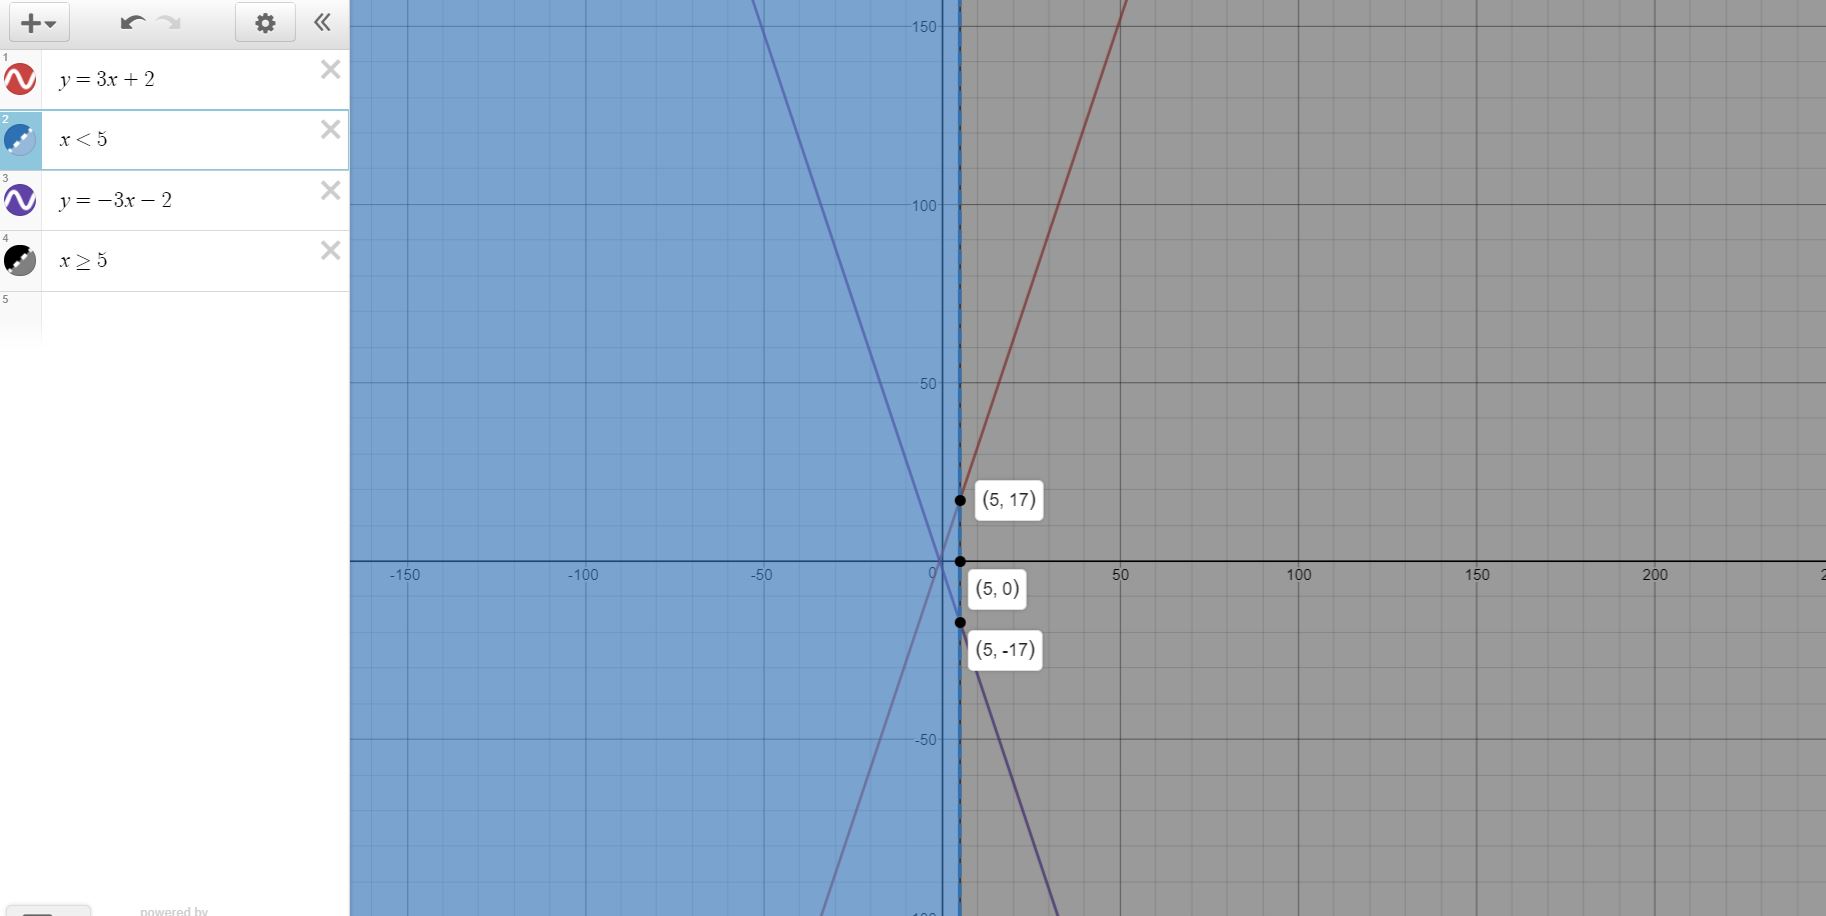
Plotting Graphs (i) and (ii) on same graph we get