How do you determine if the following data set is linear or quadratic: (-4,10), (-3,7), (-2,4), (-1,1), (0,-2)?
1 Answer

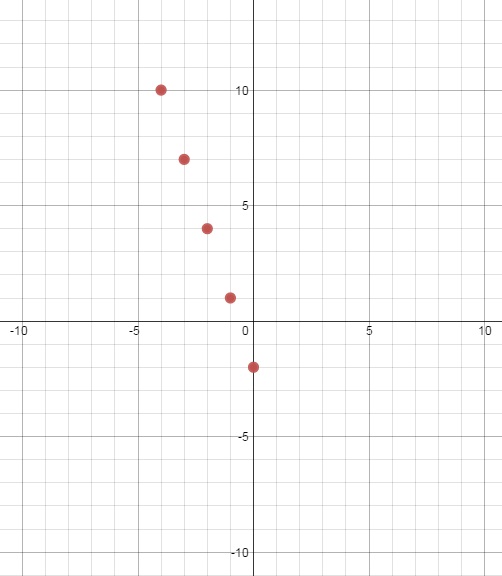
Firstly, you should try to plot this data set in order to see the behavior of it.
We can start with converting it to table to see the effect of the variable
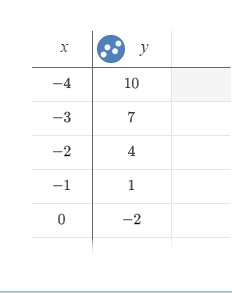
As you can see from the table, a one unit increase in
Plotting the data set is quite important to understand the behavior of the function and we can easily see that we are dealing with a data set which is linear for this case. If it was quadratic, we wouldn't be able to graphically represent it by a single line.