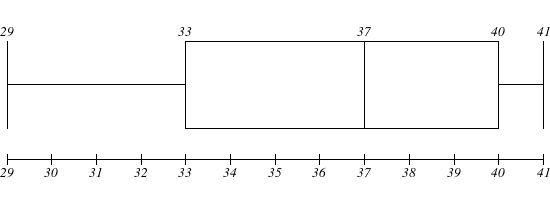
How do you draw a box and whisker plot of the data: 29, 33, 36, 37, 39, 40, 41?
1 Answer

Explanation:
The minimum is the lowest number in the data set.
Since it is listed from smallest to largest, we know that the minimum is
The median is the middle number. Cancel out
Therefore, the median is
The first quartile (Q1) is the median of the lower half of data which lies at 25% of the data.
Let's look at the lower half of numbers:
The number in the middle is
The third quartile (Q3) is the median of the upper half of data which lies at 75% of the data.
Let's look at the upper half of numbers:
The number in the middle is
The maximum is the highest number in the data set; it is
So here's the five-number summary:
Minimum: 29
First quartile: 33
Median: 37
Third quartile: 40
Maximum: 41
This is what a typical box-and-whisker plot looks like:

So here's the box-and-whisker plot for this data:

Hope this helps!

