It's best to start graphing piecewise functions by reading the "if" statements first, and you'll most likely shorten the chance of making an error by doing so.
That being said, we have:
#y=x^2" if "x<0#
#y=x+2" if "0<=x<=3#
#y=4" if "x>3#
It's very important to watch your #"greater/less than or equal to"# signs, as two points on the same domain will make it so that the graph is not a function. Nevertheless:
#y=x^2# is a simple parabola, and you are most likely aware that it starts at the origin, #(0,0)#, and extends indefinitely in both directions. However, our restriction is #"all "x"-values less than "0#, so we will only draw the left half of the graph, and leave an #"open circle"# at the point #(0,0)#, as the restriction is #"less than 0"#, and does not include #0#.
Our next graph is a normal linear function #"shifted upwards by two"# but only appears from #0 " to " 3#, and includes both, so we will draw the graph from #0 " to " 3#, with #"shaded circles"# on both #0# and #3#
The final function is the easiest function, a constant function of #y=4#, where we only have a horizontal line at the value of #4# on the #y"-axis"#, but only after #3# on the #x"-axis"#, due to our restriction
Let's see what it would look like without the restriction:
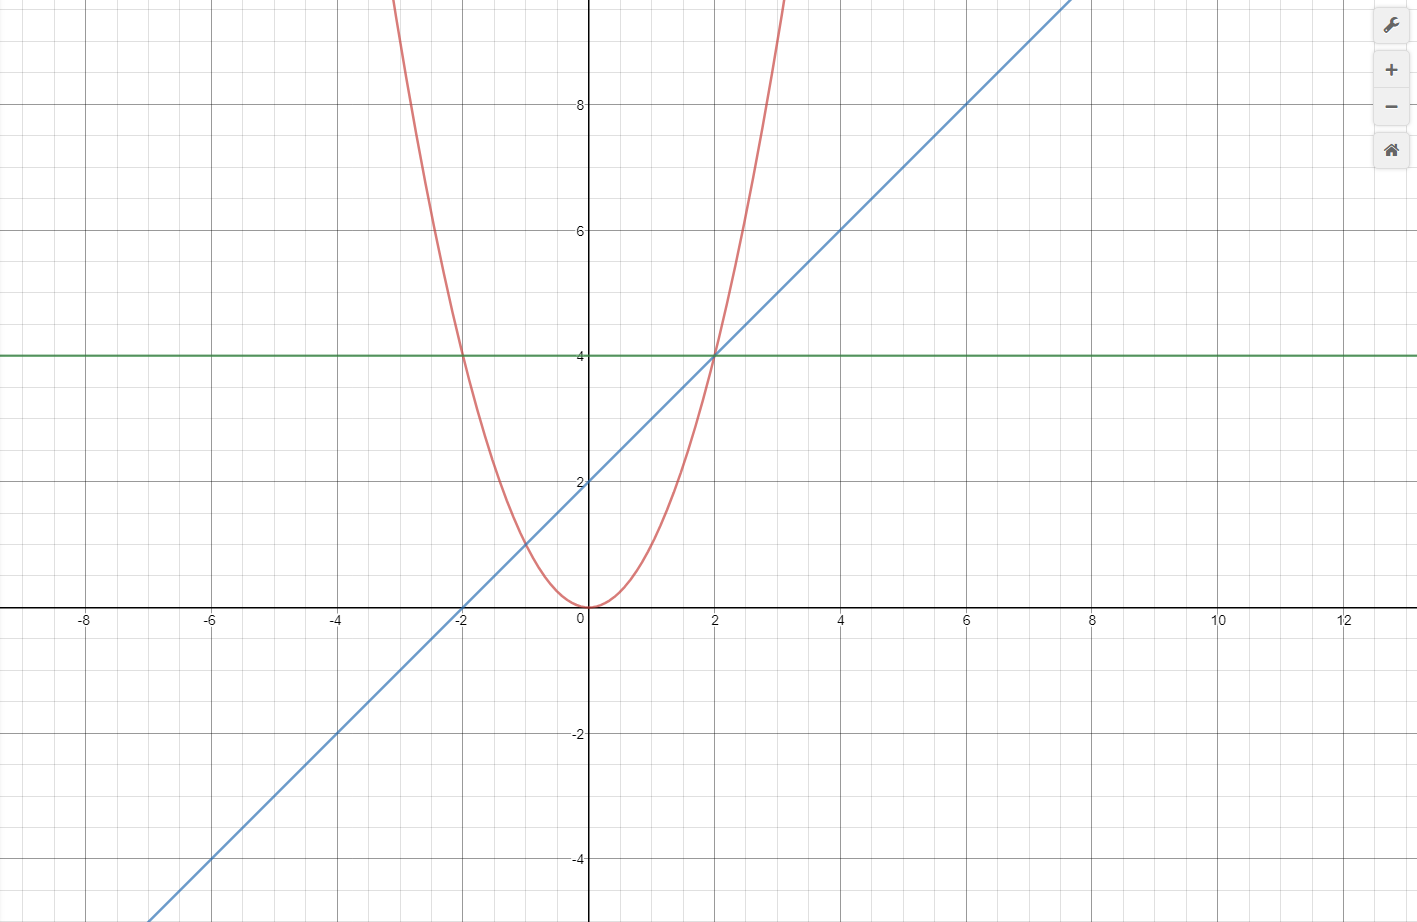
Just as explained above, we have the parent function of a #color(red)("quadratic")#, a #color(blue)("linear function")#, and a #color(green)("horizontal constant function")#.
Now let's add the restrictions in the if statements:
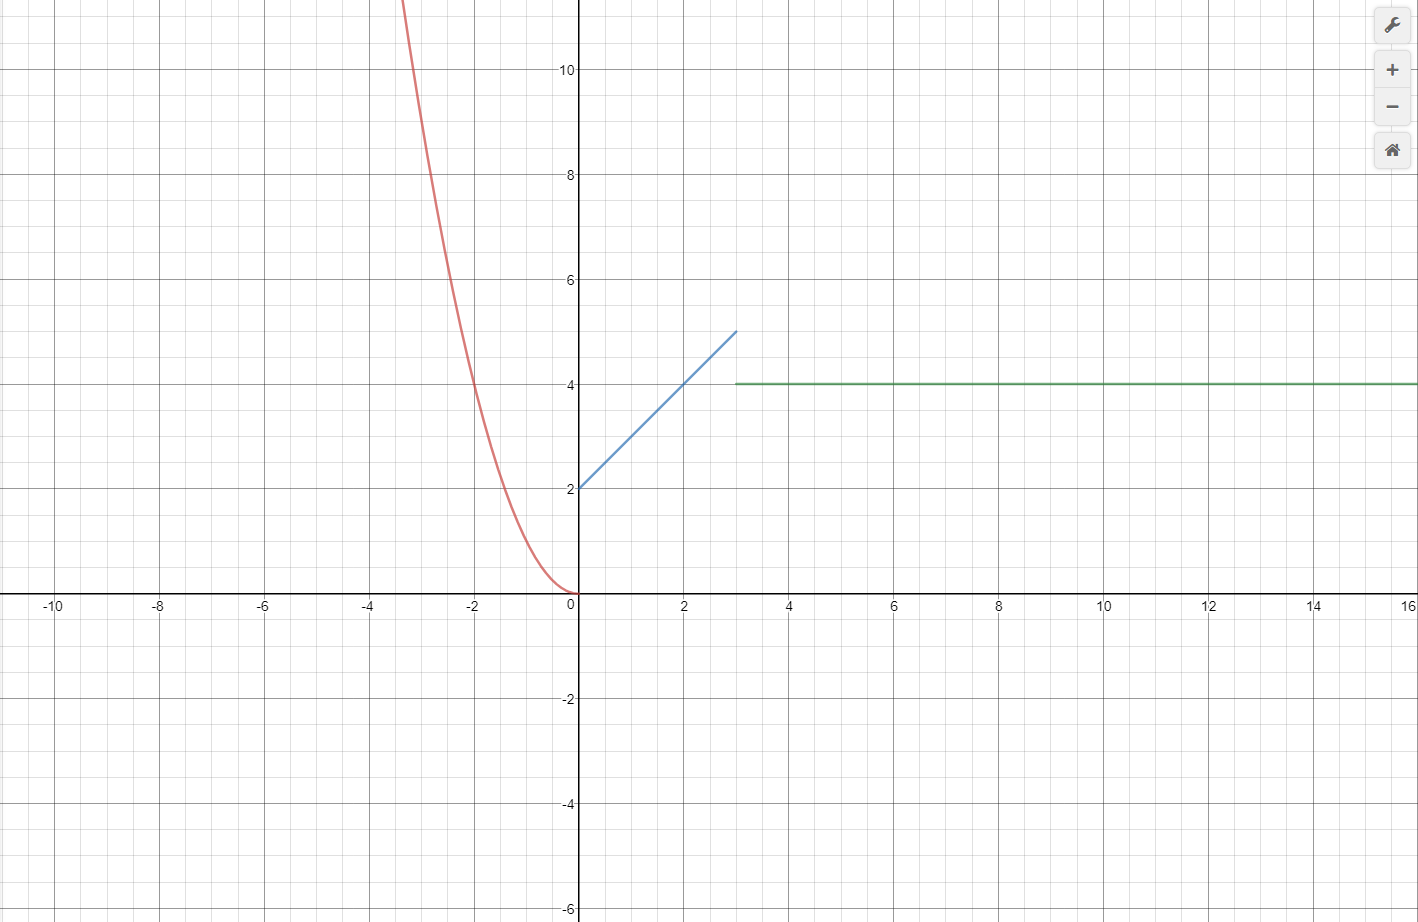
Like we said above, the quadratic only appears less than zero, the linear only appears from 0 to 3, and the constant only appears after 3, so:
#"Domain: "#
#(-oo, oo)#
#"Range: "#
# (0, oo)#
Our #"domain"# is #"all real numbers"# due to our #x"-values"# being continuous across the #x"-axis"#, since we have one shaded circle at #x=0# on the linear function, and one shaded circle at #x=3# on the linear function, and the constant function continues on infinitely to the right so, even though the functions visually stop, the graph is still continuous, hence, #"all real numbers."#
Our #"range"# starts at #0#, but doesn't include it, and goes to #"infinity"# due to the graph not going below #y=0#, and the lowest point being the #"quadratic"# not touching the #x"-axis"# at the origin, #(0, 0)#, and extends infinitely upwards.

