How do you graph #-8x+10y=40# using intercepts?
2 Answers
see explanation.
Explanation:
To find the
#color(blue)" x and y intercepts"#
#• " let x = 0, in the equation, to find y-intercept"#
#• " let y = 0, in the equation, to find x-intercept"#
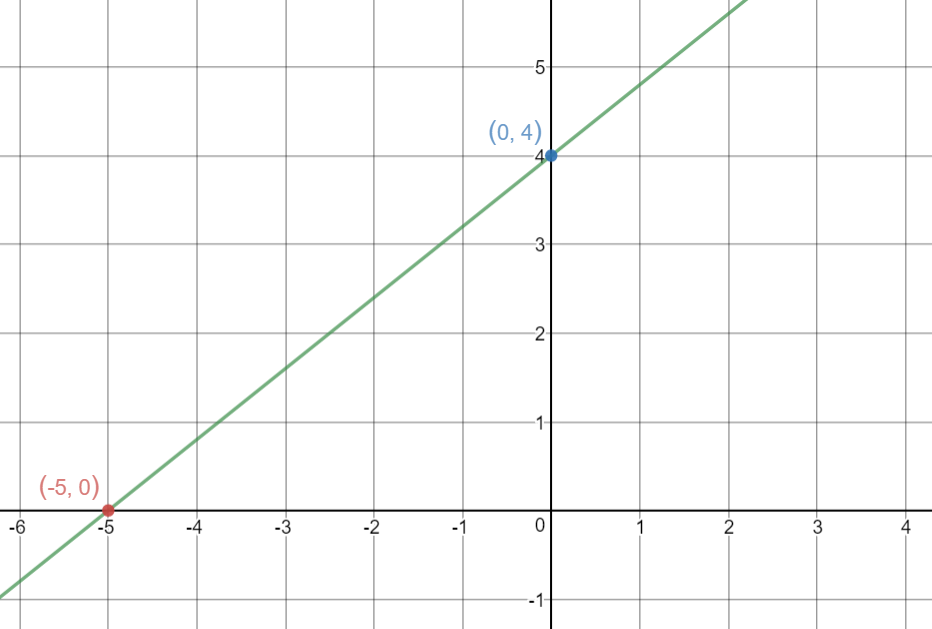
#x=0to10y=40rArry=4larrcolor(red)" y-intercept"#
#y=0to-8x=40rArrx=-5larrcolor(red)" x-intercept"# Plot the points (0 ,4), (-5 ,0) and draw a straight line through them for the graph.
graph{4/5x+4 [-11.25, 11.25, -5.625, 5.625]}

Plug in
See below for the solution with graph.
Explanation:
Keep in mind that the
It's easier to remember this if you think about the intercepts on a graph
~~~~~~~~~~~~~~~~~~~~~~~~~~~~~~~~~~~~~~~~~~~~~~~~~~~~~~~~~~~~~~~~~~~~~~~~
First, find the
#-8x + 10(0) = 40#
#color(white)"XXXX--"-8x = 40#
#color(white)"XXXXXX.." x = -5#
The
Next, find the
#-8(0) + 10y = 40#
#color(white)"XXXXX-"10y=40#
#color(white)"XXXXXX.."y=4#
The
Finally, to graph the line, just graph these two points, and connect them, as shown below.