How do you graph and find the discontinuities of #H(x) = [(x - 1) (x + 2) (x - 3)]/(x(x - 4)^2#?

1 Answer
Sep 18, 2015

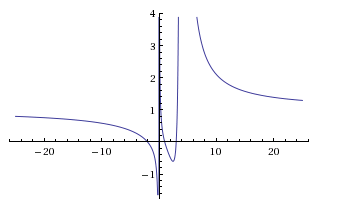
First we find every assymptote and root, and then start making a table of values. The discontinuities are the vertical assymptotes.

Explanation:

First thing we do, is look for any vertical assymptotes. Those are the values the function can never take, usually because it'll cause a math error (division by zero, logarithm of a number that's zero or negative, negative number in an even root, etc.)

In this case, the only things that can make things go wrong is the denominator. Just make the inequality, and solve it.

#x(x-4)^2 != 0#

Since it's a product, either can't be zero, so
#x != 0#
#(x-4)^2 != 0 rarr (x-4) != 0 rarr x!= 4#

We have two vertical assymptotes, and they are #x = 0# and #x=4#. Make note of it on your graph. So you won't accidentally cross it or something when plotting it later.

The horizontal or slant assymptotes are basically extremes. What happen when the value of x get infinitely big. We could just keep plugging bigger and bigger numbers until we see a pattern, or, we can pretend #x# is a number #k# that is as big as we need, and see if we can find a general value for the assymptotes.

#H(k)=((k−1)(k+2)(k−3))/(k(k−4)^2)#

Since #k# is as big as we want it to be - and we want it to be as big as possible - we can safely say that #k-a~=k# where #a# is a constant value. Basically, #k# is so big that it's always orders of magnitude above the biggest constant on the function, so we can just ignore substractions or additions.

#H(k) ~= (k*k*k)/(k*k^2)=k^3/k^3=1#

Basically, when #|x|# becomes really, really big, #H(x)# has a tendency to go to 1. For all we know, it never becomes 1, or it becomes 1 for a small value of #x# and then it just above 1, it doesn't really matter. The important thing is for big values of x, the function stay close to 1.

So we have a horiontal assymptote (since it's a horizontal line), #y=1#, make note of it on your graph.

Now, since we have our suggestion's guidelines, all that's left is actually picking values and then connecting the dots. We know this function has 3 roots, that is, three points of the form #(x,0)#.

They're #x=1#,#x=-2# and #x=3#. We know this because the function's already conveniently factored. So you can make note of these on your graph too. In the end the graph should look something like this (the middle part will depend on how big the spacing is, but the general outline should be similar):

Plotted by Wolframalpha, from -25 to 25