How do you graph #f(x)= -1/2x-3# using a table of values?
2 Answers

Simply input your values for
Explanation:
For example, say you have have
Then solve for
Repeat this for
Solve for
Finally, for
Solve for
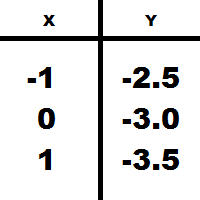
Your final results in a table of values would look like this:
and if your curious, the graph would look like this:
graph{((-1/2)x)-3 [-5.666, 4.334, -4.02, 0.98]}

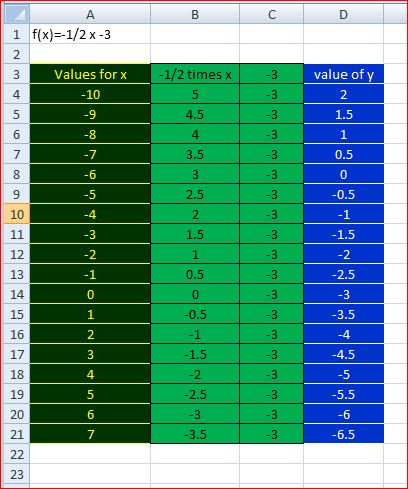
Just another table construct example with comments
Explanation:
As this is a strait line graph then technically you only need 2 points and then you can draw a line between and beyond them. However I would recommend 3 points. If they all line up then there is every chance that your calculated values are correct.
'~~~~~~~~~~~~~~~~~~~~~~~~~~~~~~~~~~~~~~~~~~
The problem comes when you have a graph of a line that is not strait. You then have to produce a table for a number of points as needs dictate. These points will then be marked on the graph paper and connected by a curved line which (if free hand) you will have to produce as best as your 'eye' permits.
'~~~~~~~~~~~~~~~~~~~~~~~~~~~~~~~~~~~~~~~~~~~~~
If the source equation is complex then this type of layout (stepwise construct) really helps.