#" "#
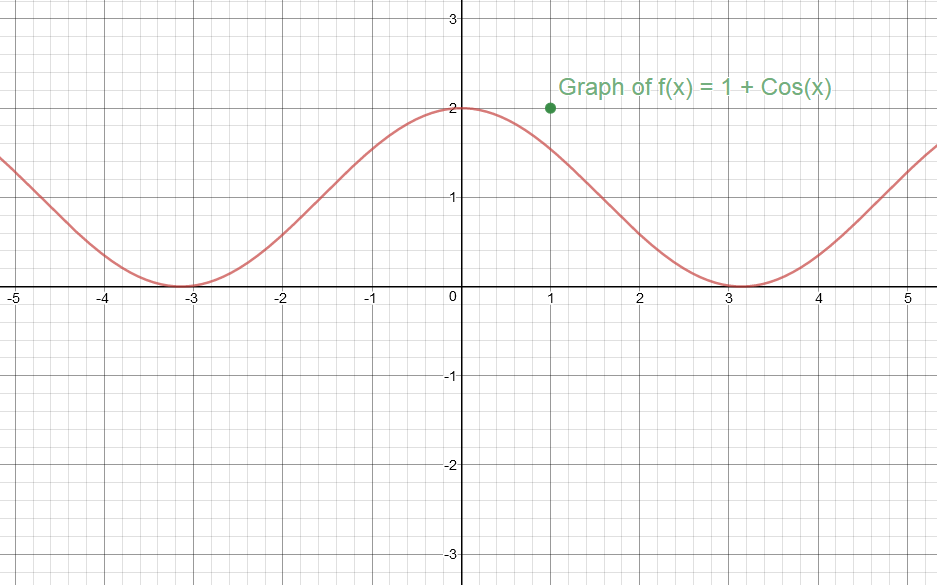
To graph #color(red)(f(x)=1+Cos(x)#,
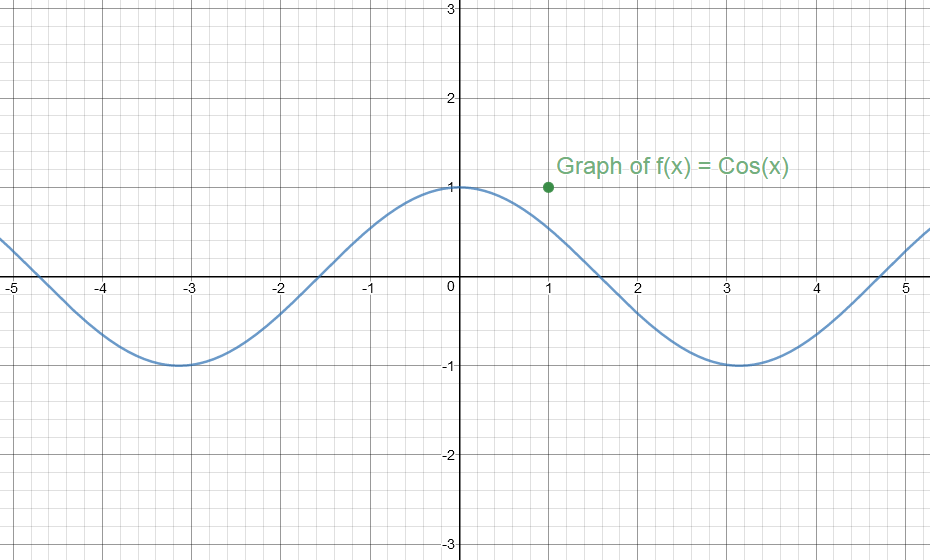
start working on it's Parent Function #color(blue)(f(x) = Cos(x)# first.
Make a table of values for #f(x)=Cos(x) and f(x)=1+cos(x)#
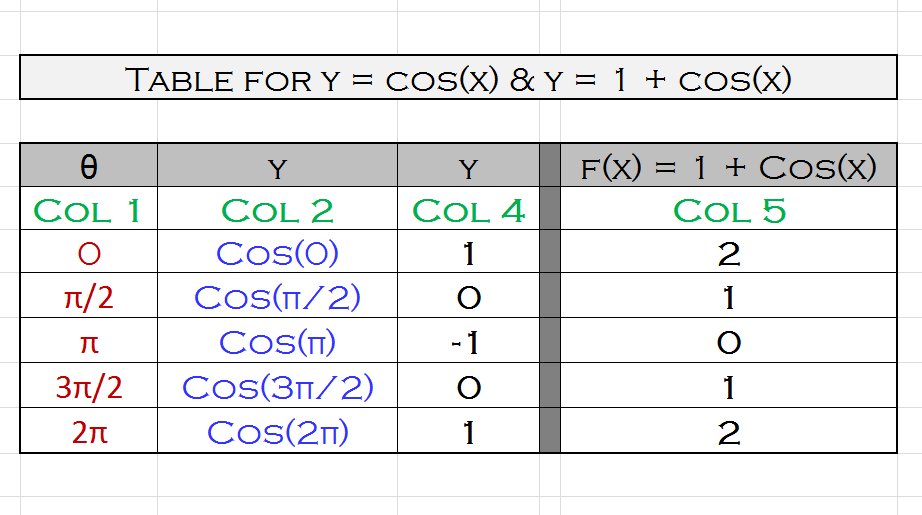
For #color(red)(x#, consider the values #color(red)(0, pi/2, pi, (3pi)/2 and 2pi#.
If you examine #color(green)("Col 4" and "Col 5"#, you see that the difference is 1.
#color(red)("Graph of y = f(x) = Cos(x)"#
#color(red)("Graph of y = f(x) = 1 + Cos(x)"#
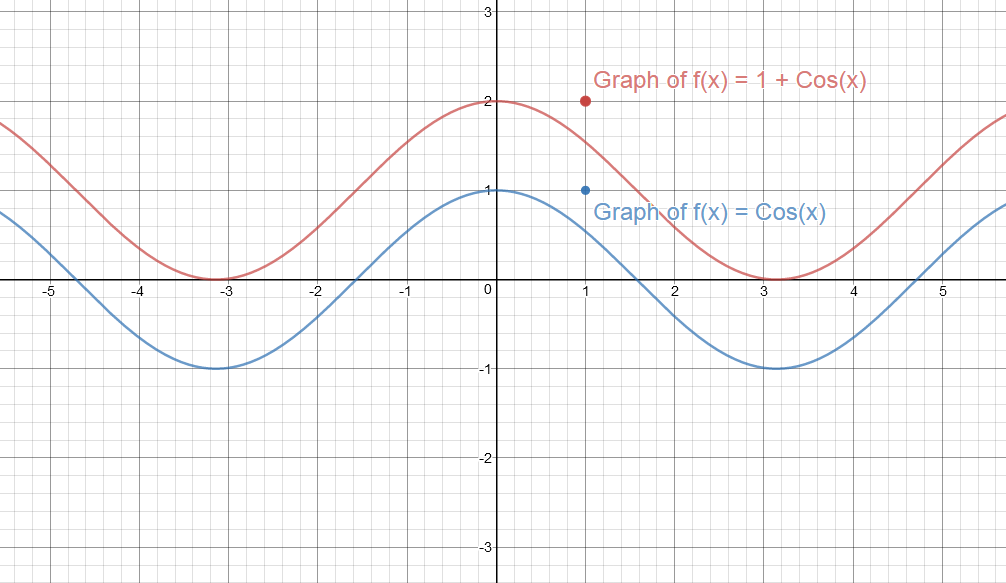
#color(red)("Graph of y = f(x) = Cos(x)")# & #color(blue)("y = f(x) = 1 + Cos(x)"#
Use #color(green)(y=A*sin(Bx+C)+D# [ or ]
use #color(green)(y=A*cos(Bx+C)+D#,
where, Amplitude is #|A|#
Period is #(2pi)/B# and
Vertical Shift is #D#
Since #D=1#, the graph is shifted vertically by 1 unit.
If #D# is given, the value of #D# is responsible for a vertical shift.
Hope it helps.

