How do you graph #f(x)=2 sin(x/3)#?
1 Answer
Plot the maxima, minima, and intercepts over one period, then extend the graph in each direction.
Explanation:
Your equation is
Step 1. Express your equation in the form
Then
Step 2. Calculate the range, period, phase shift, and vertical displacement.
The amplitude is
The period is
The phase shift is
The vertical shift is
Step 3. Divide the period
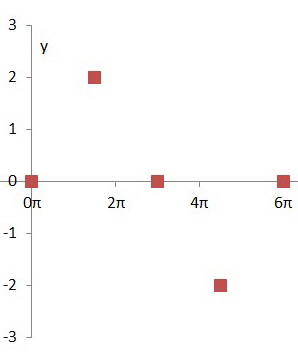
These points are
- (
#0,0# ) = intercept - (
#(3π)/2,2# ) = maximum - (
#3π,0# ) = intercept - (
#(9π)/2,-2# ) = minimum - (
#6π,0# ) = intercept
Step 4. Plot these five key points.

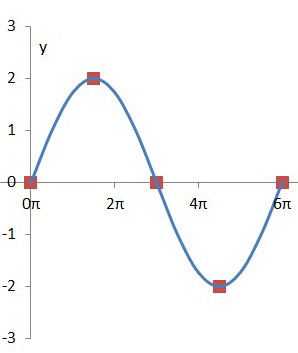
Step 5. Join these points with a smooth curve.

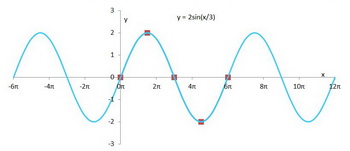
Step 6. Follow the pattern and extend your axis from

And you have your graph.

