How do you graph #f(x)=(2x^2+1)/(x^3-x)# using holes, vertical and horizontal asymptotes, x and y intercepts?
1 Answer

We can graph this equation using a sign chart.
Explanation:
First, let's identify the holes, vertical and horizontal asymptotes and x and y intercepts.
Horizontal Asymptotes
Observing the formula, we can see the degree of the denominator is higher than the numerator (The degree is the largest exponent in a polynomial). This means there will be an asymptote at
Vertical Asymptotes
In order to find vertical asymptotes, we muct factor the denominator. Factoring out an
Holes
Holes occur when there is a zero in both the numerator and denominator that will cancel. There are none in this formula.
X-Intercepts
To find x-intercepts, substitute 0 for
There are no x-intercepts as the equation above would result in imaginary numbers as answers (
Y-Intercepts
To find y-intercepts substitute 0 for
As the denominator equals zero the equation is undefined. Therefore there are no y-intercepts.
Sign Chart
Using the values above, also known as critical values, we will create a sign chart. We do this by sorting the critical values from least to greatest, and surrounding them with
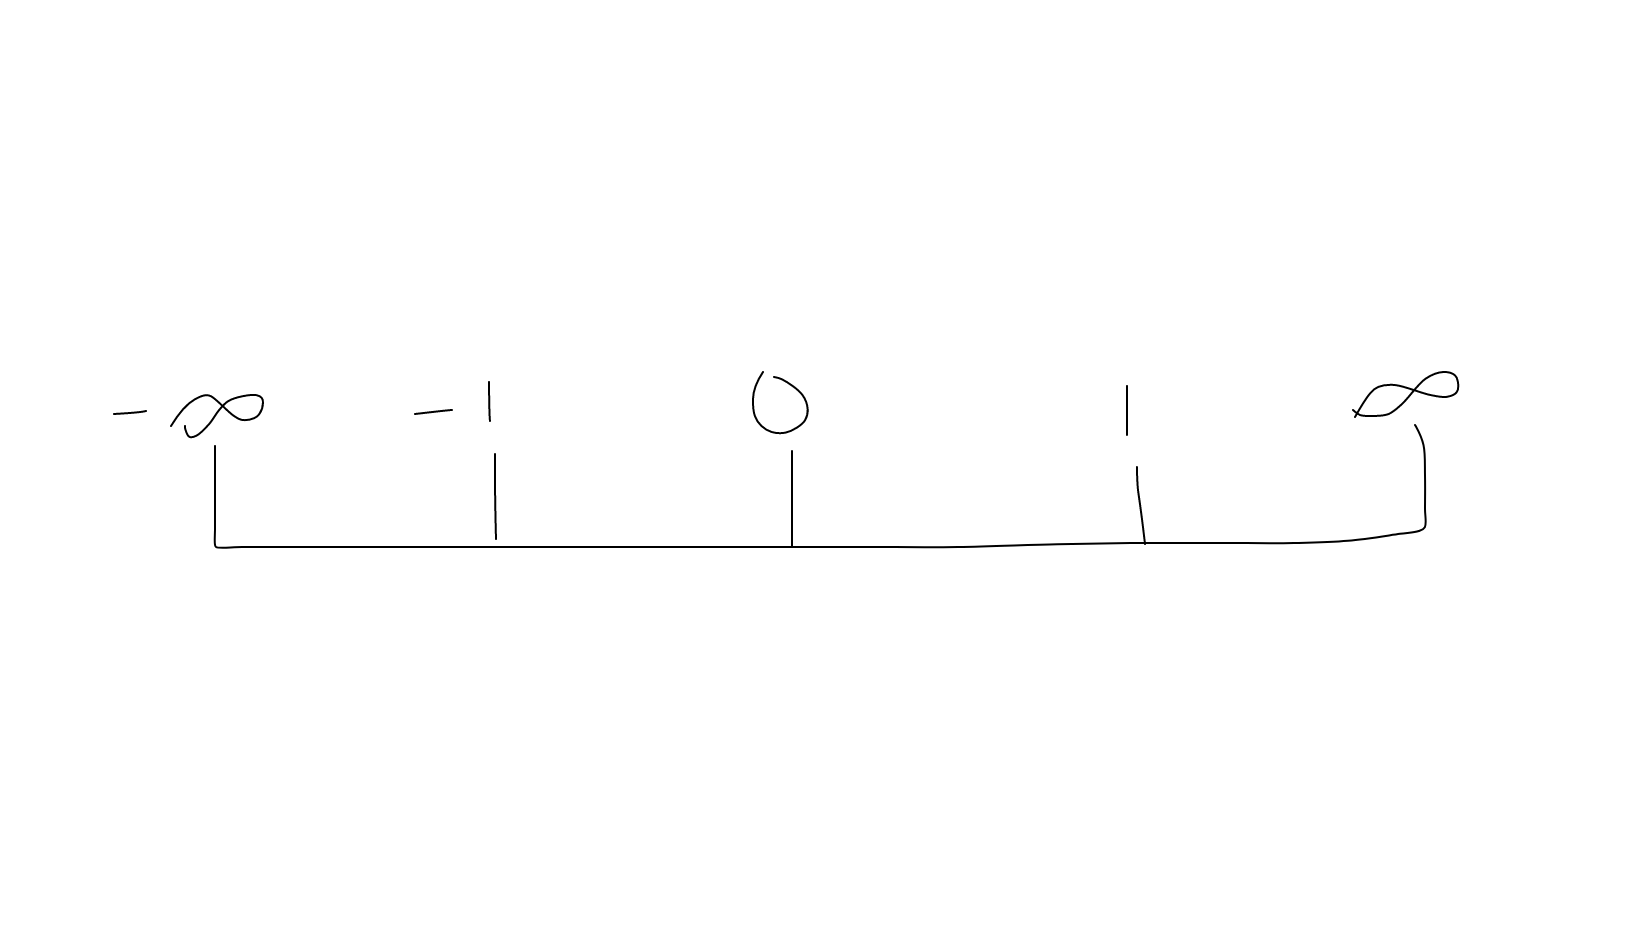
We will then select a value for
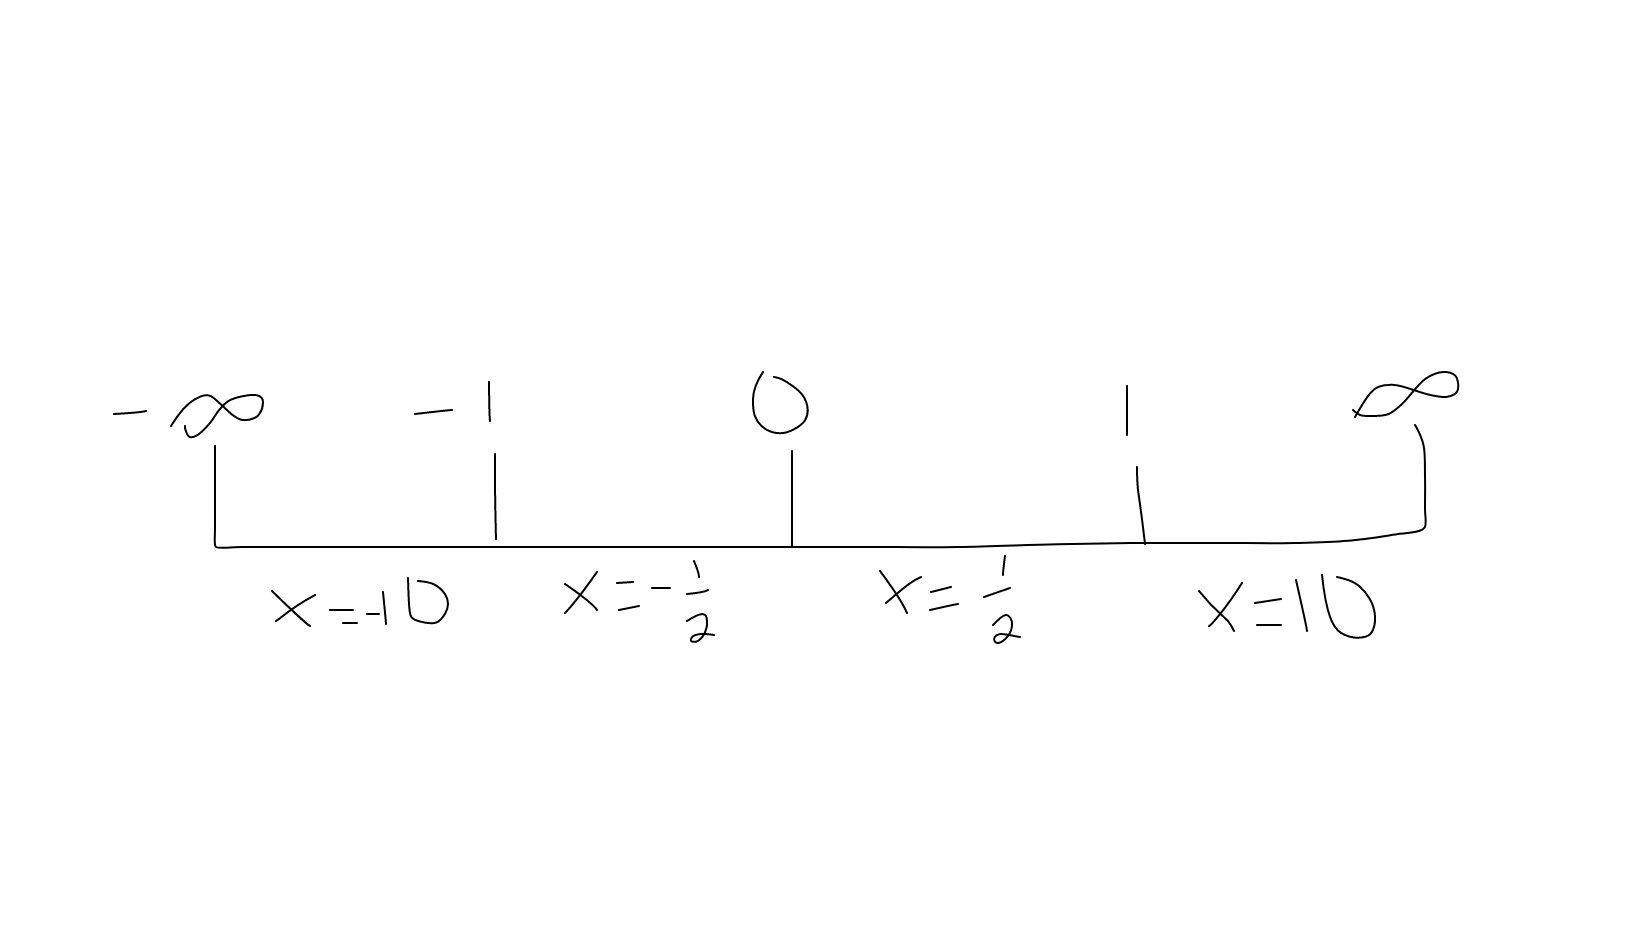
We will test the
We don't necessarily care about the value, just whether it is positive or negative. Since it is positive, we will mark a
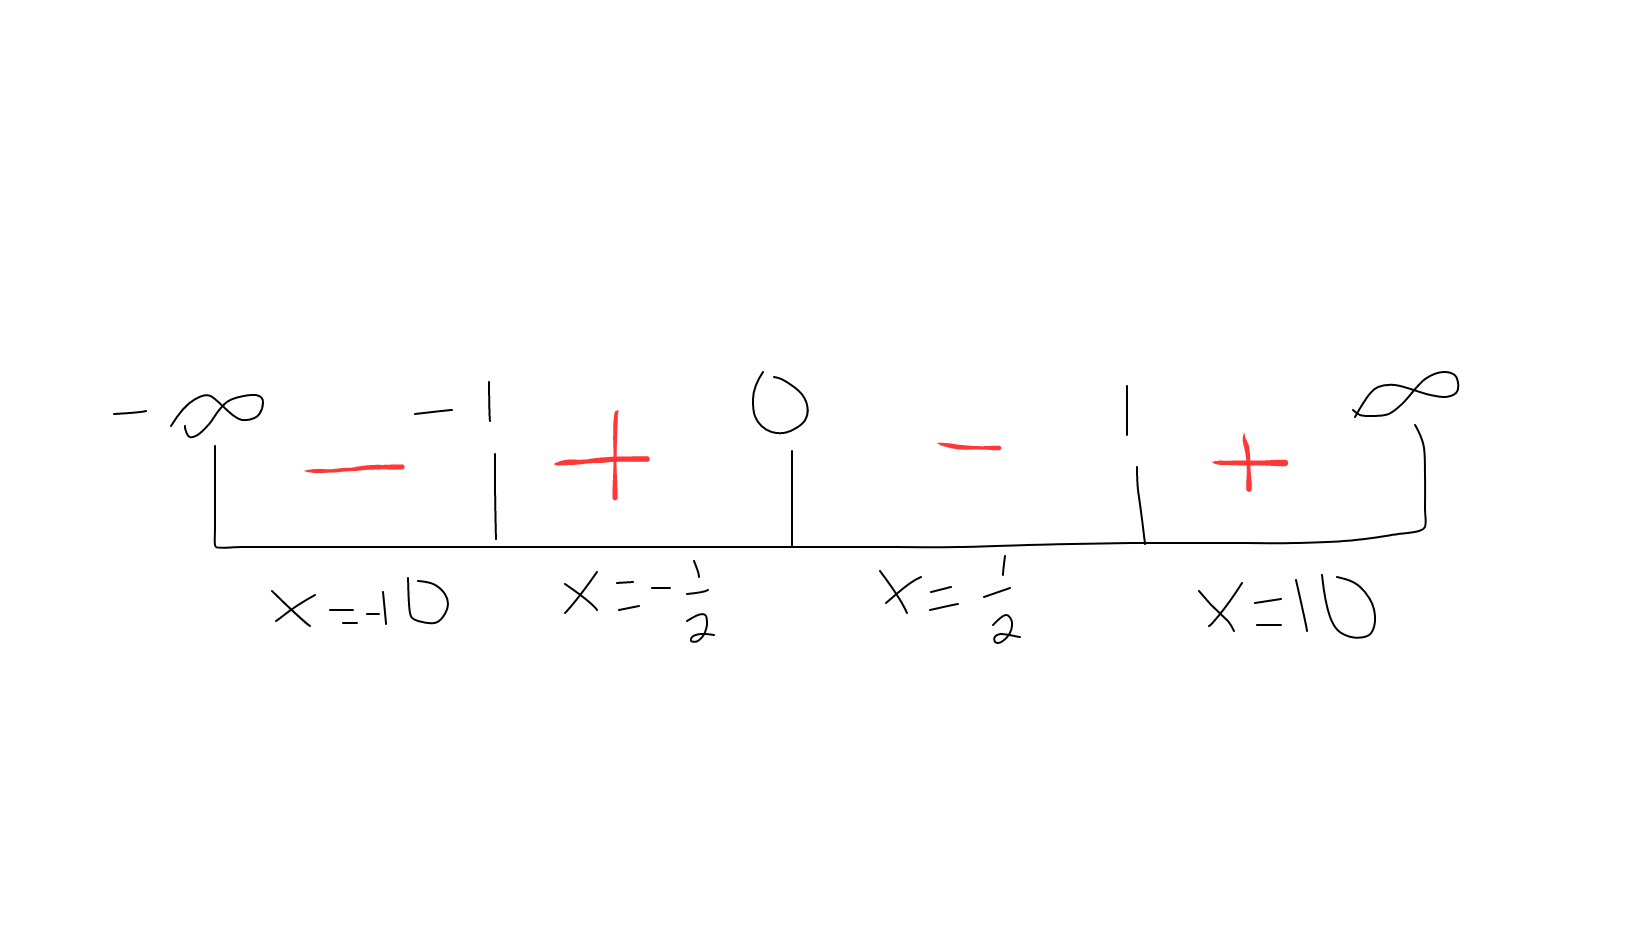
We are now able to graph now that we know where the function is positive and negative and we have the asymptotes.
graph{(2x^2+1)/(x^3-x) [-10, 10, -5, 5]}
Notice how the graph is positive where we noted positive, and negative where we noted negative.
