How do you graph #f(x)=-x^2+3, x>=0# and then use the horizontal test to determine whether the inverse of f is a function?
1 Answer

Graphs of
The shaded region clearly indicates
Explanation:
Horizontal Line Test will determine whether the Inverse of f(x) is also a function.
When we investigate the graph of
Investigate the graph below. I have chosen a few sample values as y = -0.5, y = +0.5, y = +1.5 and x = +2.5 for the horizontal line test. We can see that all these horizontal lines intersect the graph (in the shaded area) in only ONE location.
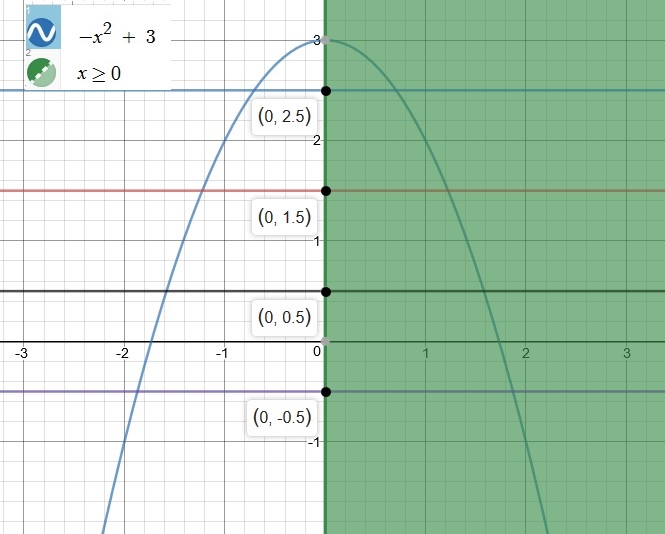
Hence, we can conclude that the inverse of f(x) will also be a function.
we are given
To find the Inverse of
Write
Switch
We get
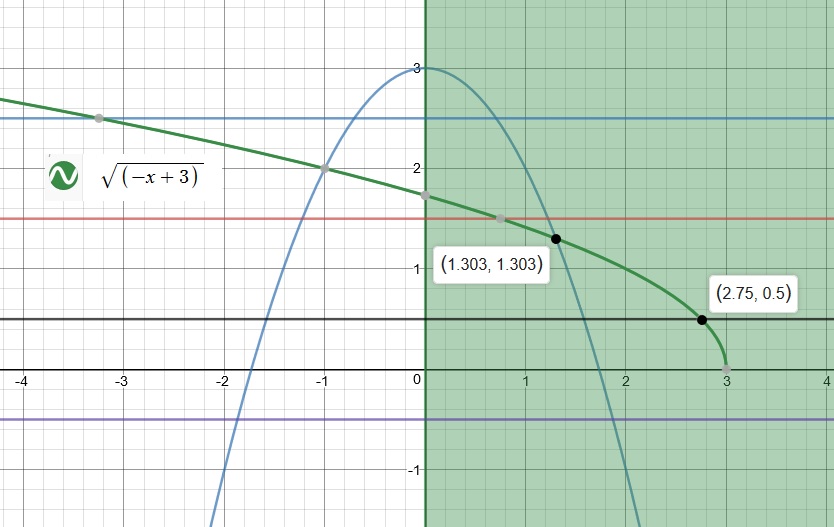
The inverse of our function
Inverse of
To verify our observations, please investigate the graph below:
I hope you find the solution useful.
