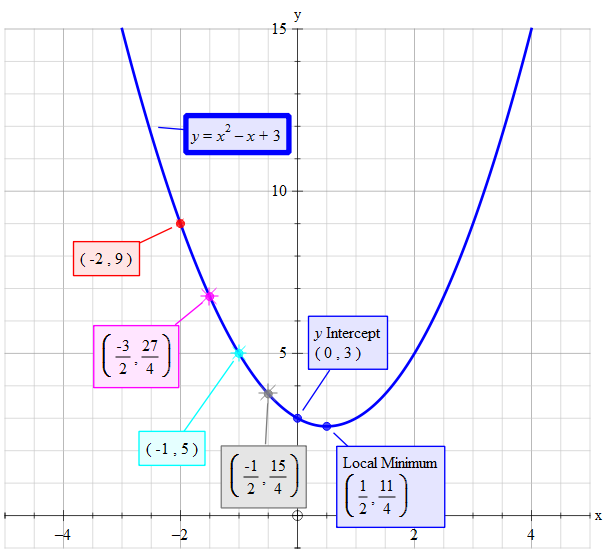
How do you graph #f(x)=x^2 - x+3# by plotting points?

1 Answer
Apr 5, 2017

See explanation

Explanation:

#color(brown)("As "x^2" is positive the graph is of form "uu)#

Additional comment: if we had #-x^2# then the graph would be #nn#

For a moment consider the equation as: #y=x^2color(red)(-1)xcolor(magenta)(+3)#

#color(green)("Then "x_("vertex") = (-1/2)xxcolor(red)(-1)=+1/2 ->(x,y)=(1/2,y))#

#color(green)("Also "y_("intercept") = color(magenta)(+3) ->(x,y)=(0,3))#

~~~~~~~~~~~~~~~~~~~~~~~~~~~~~~~~~~~~~~~~~~~~~~~~~~~
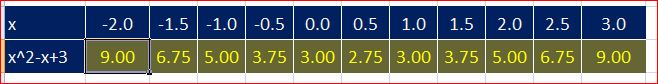
Build a table of values.
Tony B

Mark your points and draw a curved line #uu# through all the points as best as you can. To obtain mote marks show you table. Either on the graph itself or separately.

#color(red)("I have only shown a few of the points")#
Tony B