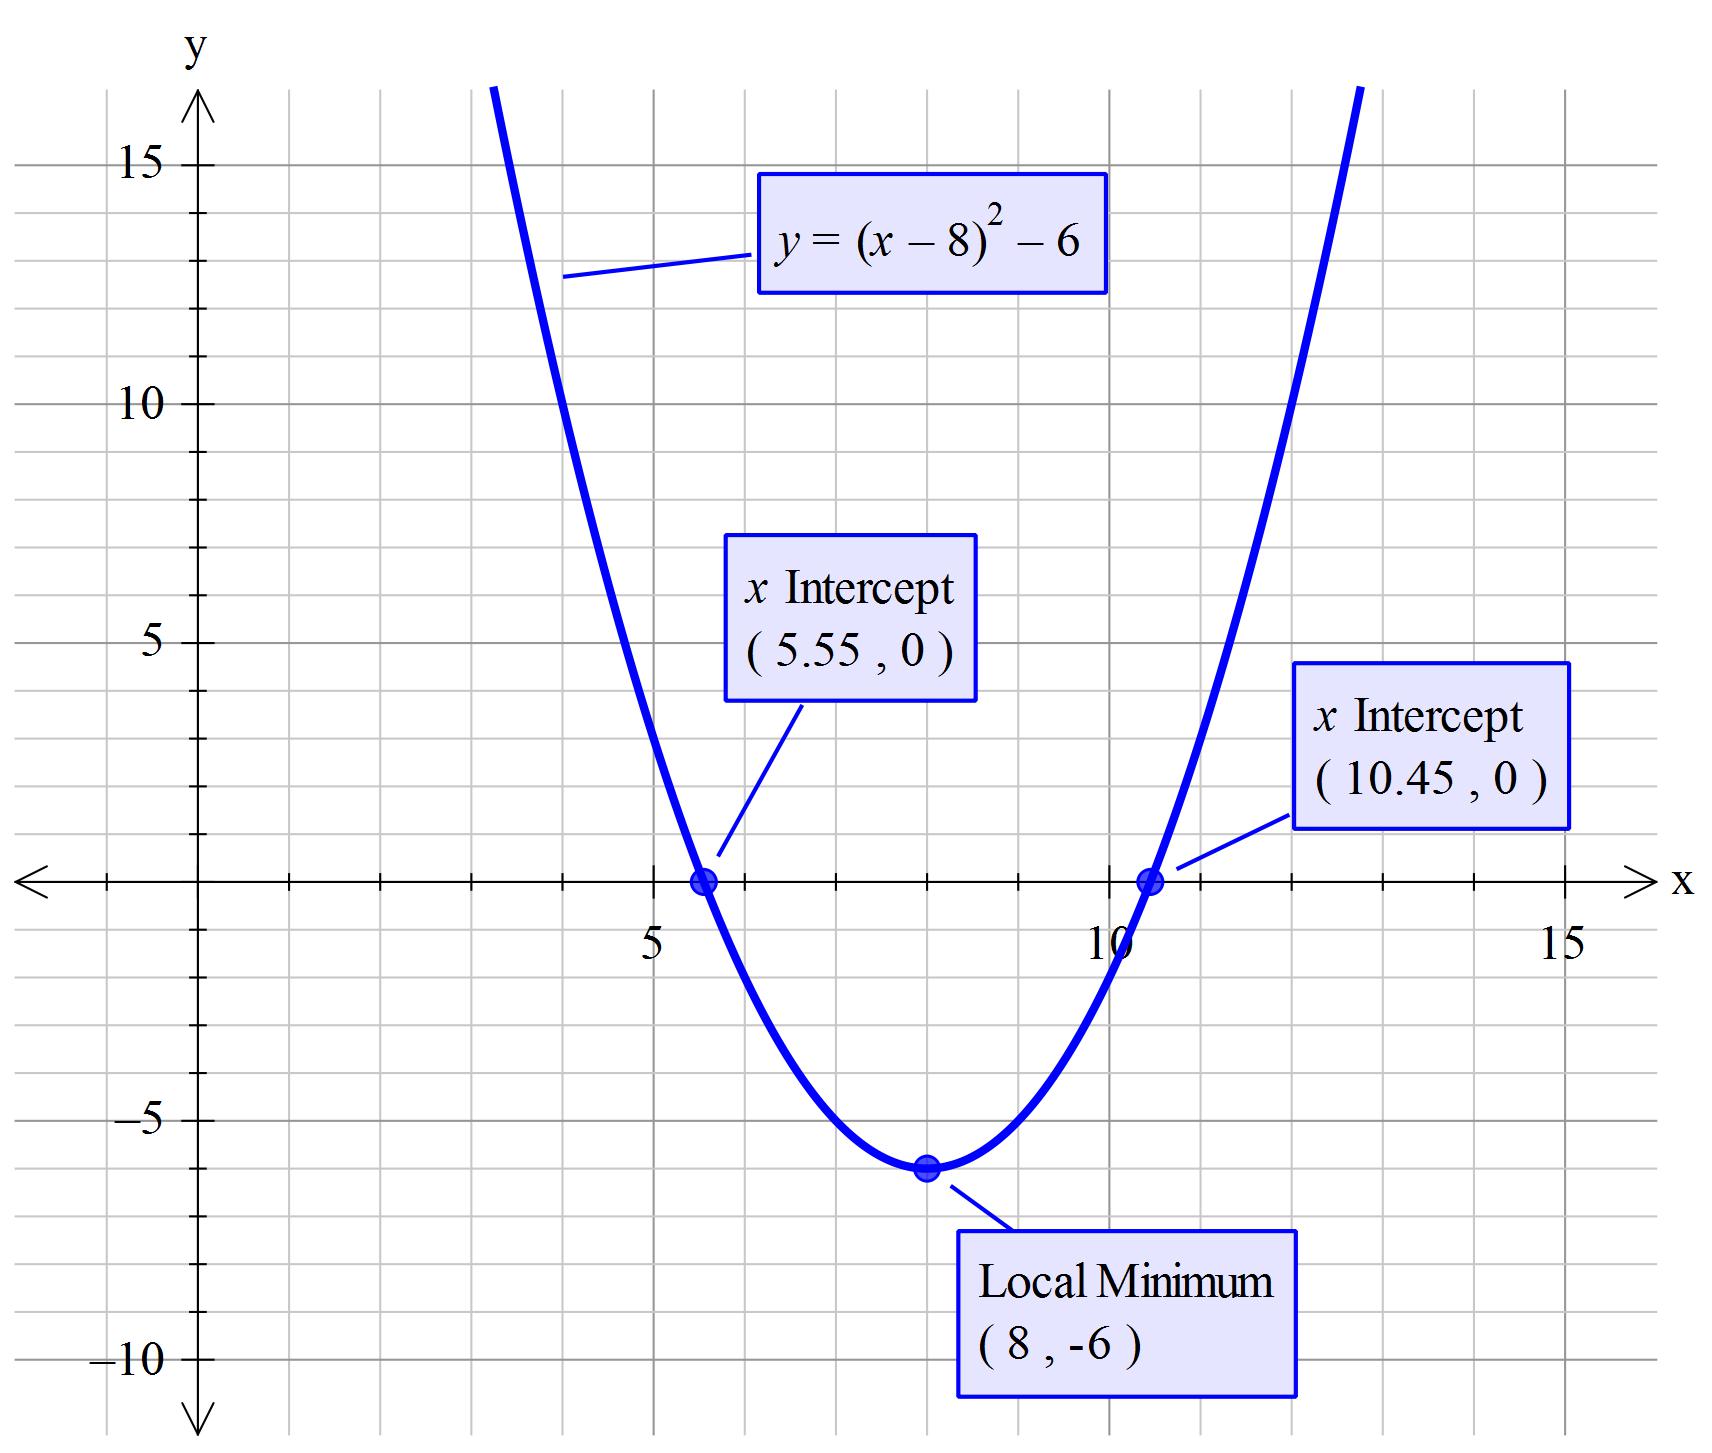
How do you graph #f(x) = (x - 8)^2 - 6#?

1 Answer
Aug 25, 2016

Vertex#->(x,y)=(8,-6)# and is a minimum
#x_("intercept")~~10.45 " and " 5.55# to 2 decimal places
#y_("intercept")=58#

Explanation:

The short answer is to build a table of values for x and y and then plot each point and draw your line through them.

However. If you meant how do you determine the critical points to sketch the graph then that is very different.
'~~~~~~~~~~~~~~~~~~~~~~~~~~~~~~~~~~~~~~~~~~~~~~~
Given:#" "f(x)=(x-8)^2-6=y#

#color(blue)("Determine the vertex")#

#color(brown)("The given equation is in vertex form")#

Looking at just the equation part: #(x-8)^2# we have #x^2-16x+64#
The main point of focus being the #+x^2#

AS this is positive the generic graph shape is of form #uu# so we have a minimum.

You can almost directly read off the vertex coordinates from this equation form:

#x_("vertex")=(-1)xx(-8) = +8#
#y_("vertex")=-6#

#color(green)("Vertex"->(x,y)=(8,-6))#
'~~~~~~~~~~~~~~~~~~~~~~~~~~~~~~~~~~~~~~~~
#color(blue)("Determine y intercept")#

y intercept at #x=0#

#color(green)(=>y=(0-8)^2-6 =58)#
'~~~~~~~~~~~~~~~~~~~~~~~~~~~~~~~~~~~~~
#color(blue)("Determine x intercept")#

This it at #y=0#

#=>(x-8)^2-6=0#

#(x-8)^2=6#

Square root both sides

#x-8=+-sqrt(6)#

#x=8+-sqrt(6)#

#x_("intercept")~~10.45 " and " 5.55# to 2 decimal places
'~~~~~~~~~~~~~~~~~~~~~~~~~~~~~~~~~~~~~~~~~~
#color(red)("Note that you will need to draw the y axis such that it shows the")##color(red)("graph crossing it at y=58.")#

Tony B