How do you graph the system #y < x - 5# and #y ≤ 3#?
1 Answer

Please read the explanation.
Explanation:
We have the inequality:
How do we graph this inequality ?
Note that,
Hence, the region that is common for both sets of inequalities will indicate the required solution.
We can create a data table for both these inequalities separately as shown below:
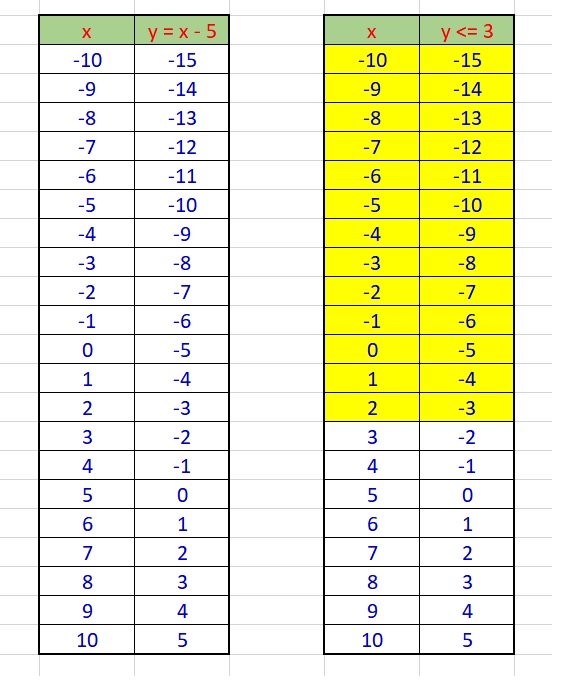
The values in the common
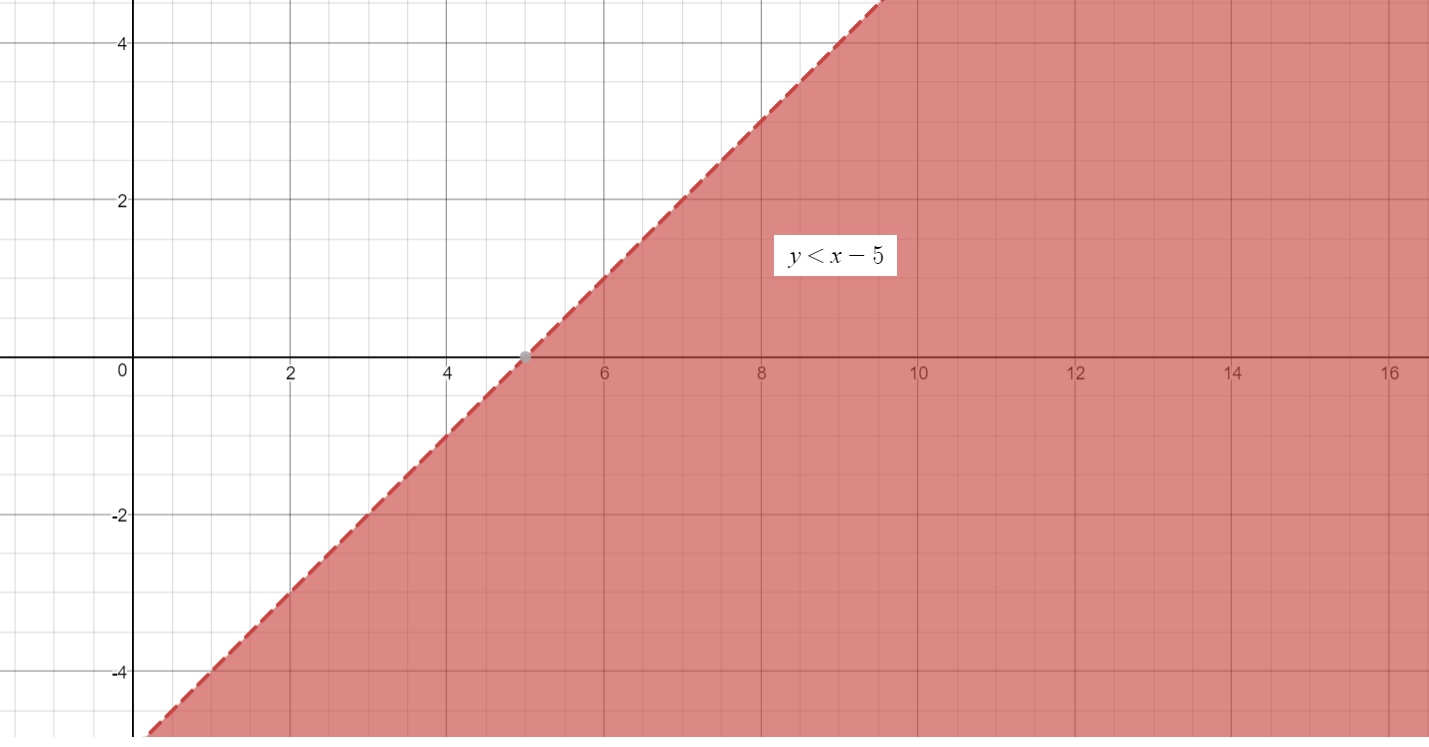
Dotted line indicates value not included in the solution.
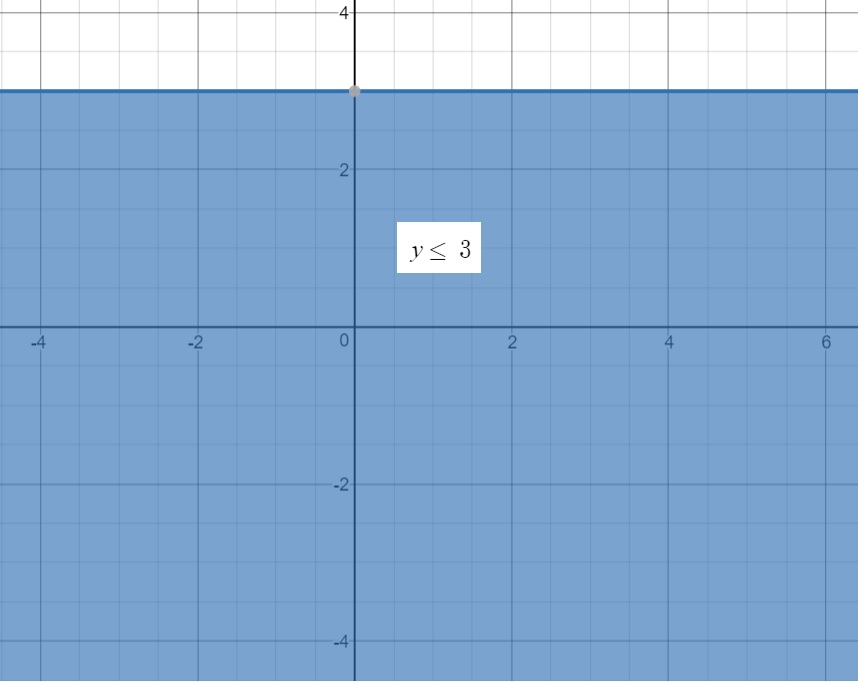
Solid line indicates the value being part of the solution.
This is our final solution graph, as it accommodates the restriction used in the given inequity.
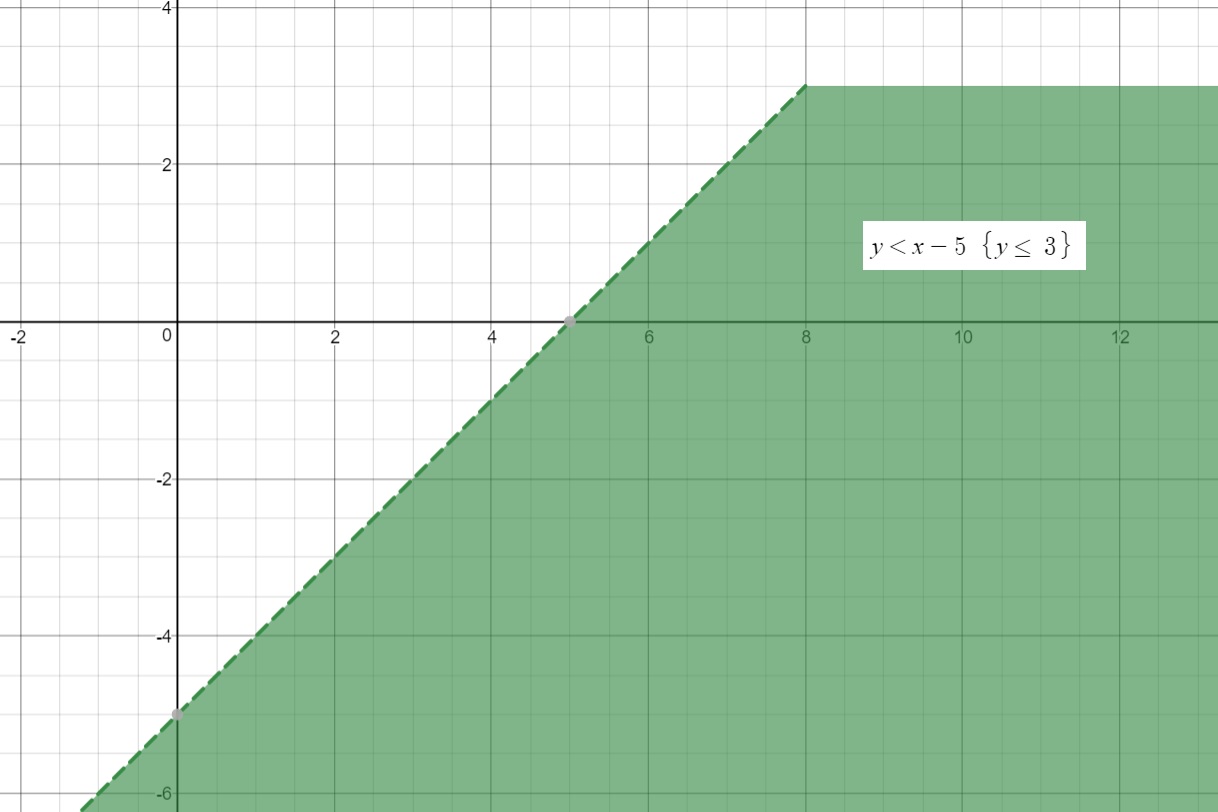
Some of the points from the table (shaded values) are indicated in the solution graph below, for a better comprehension:
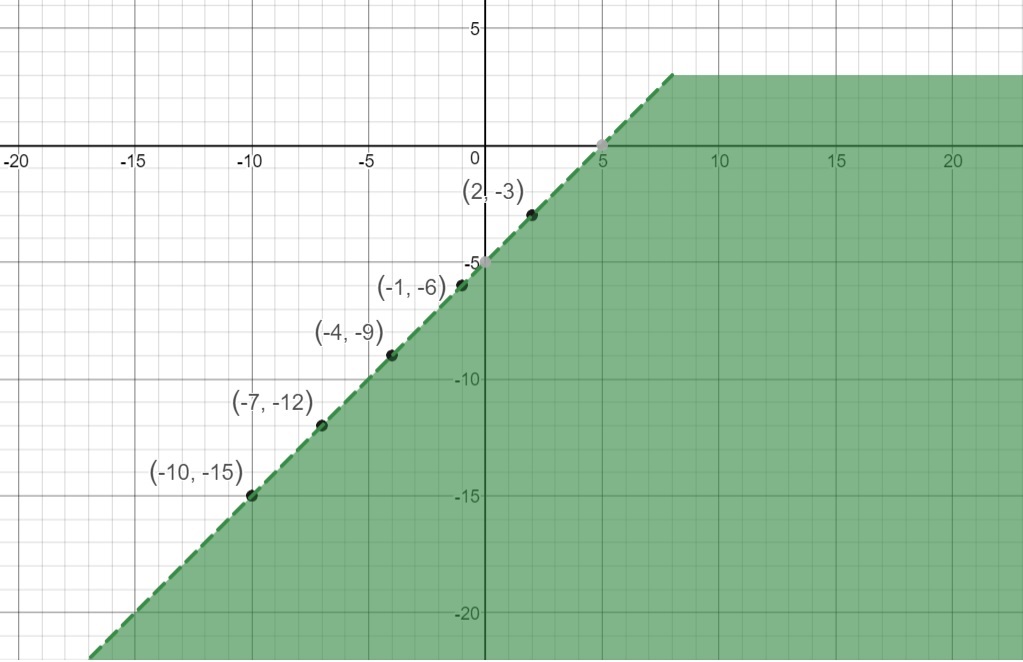
This final graph indicates the common region between Graph.1 and Graph.2.
In Set Theory, we use the term intersection to refer to the common values between two sets of values.
Hope this explanation helps.
