How do you graph #x+2y=10# by plotting points?
1 Answer

See explanantion
Explanation:
Given
changing the formula so that it is in standard form
Subtract
Divide both sides by 2 so that we have
'~~~~~~~~~~~~~~~~~~~~~~~~~~~~~~~~
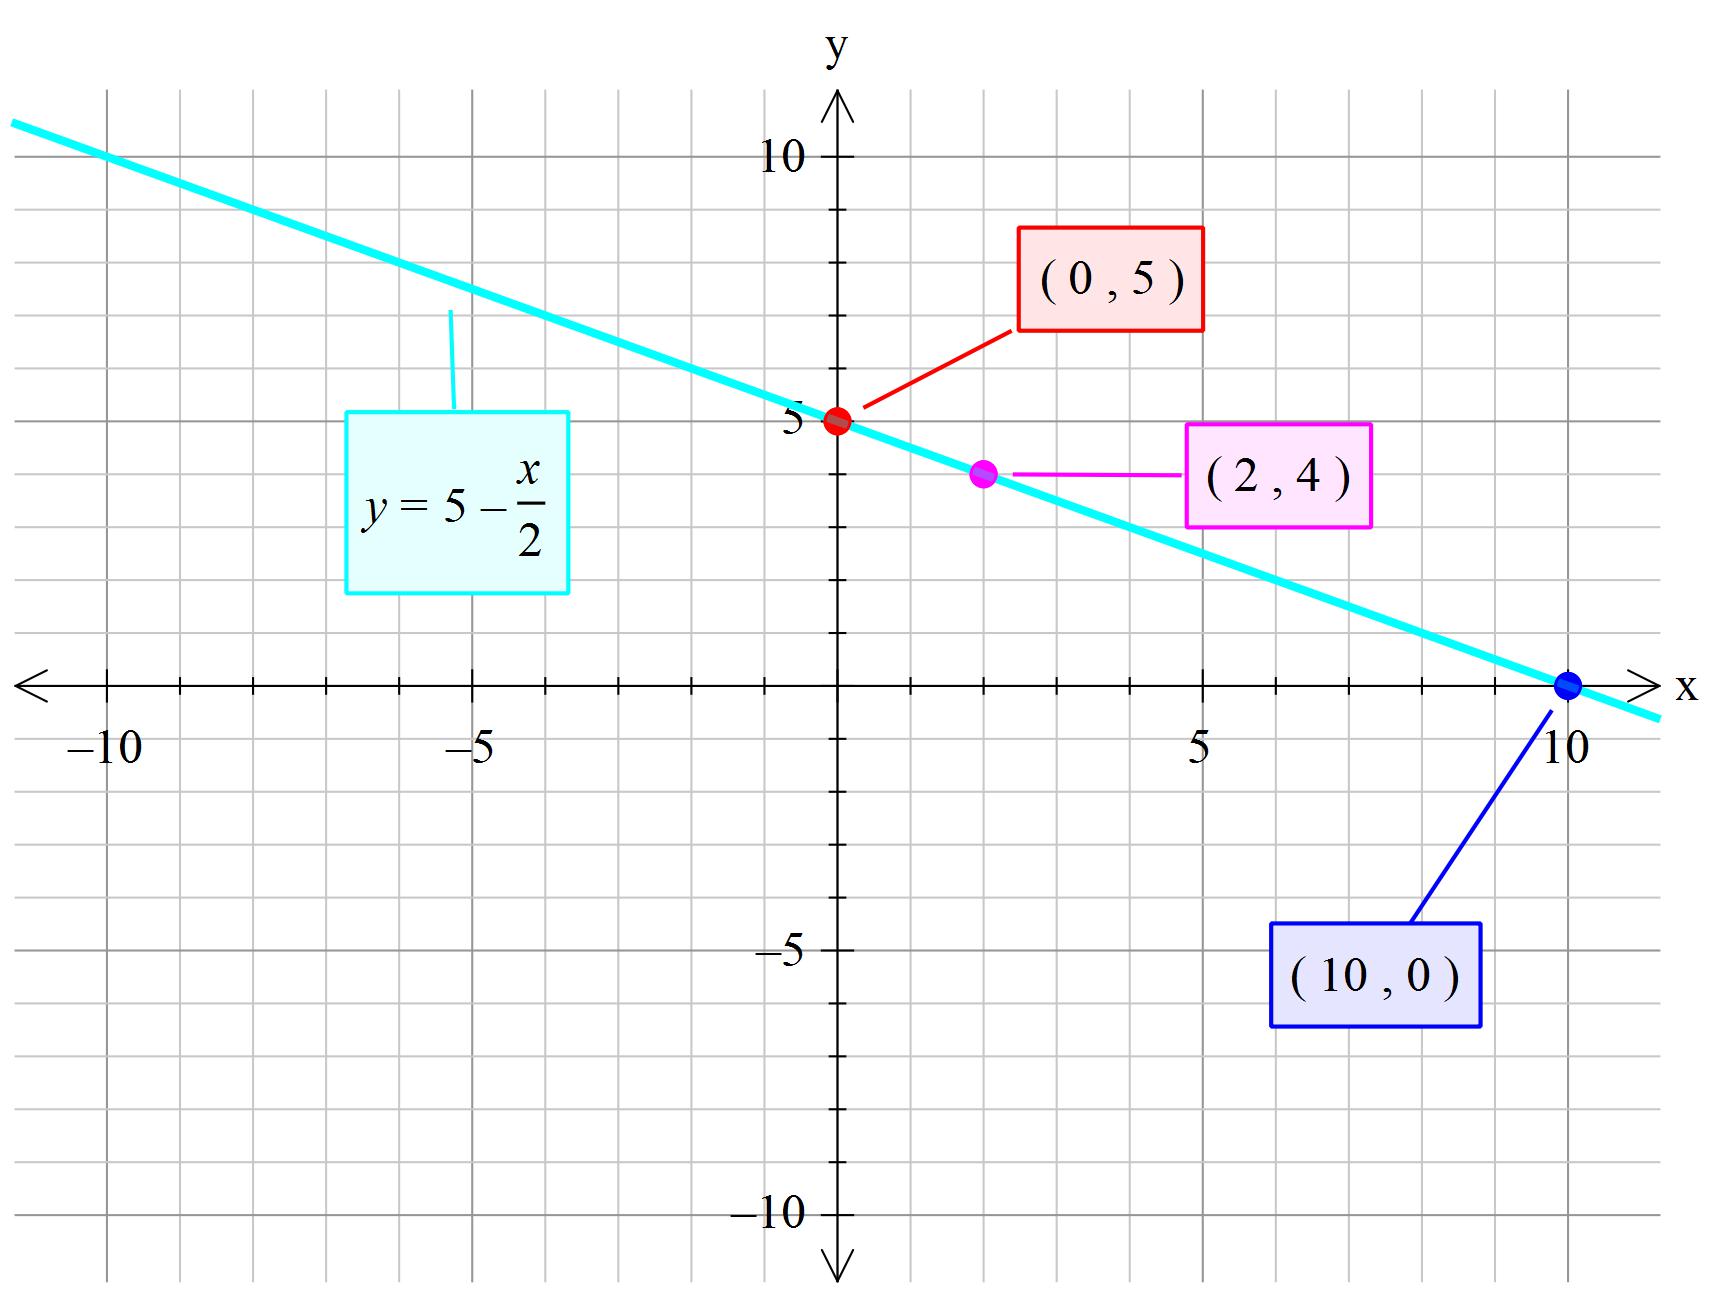
This graph can be drawn if only two points are known but it is better to do 3 as a check to see if there is an error in your calculation. No error would mean that all the points line up. If not then check you calculations.
I chose the point where the graph crosses the x-axis
( x intercept ). To do this set
'~~~~~~~~~~~~~~~~~~~~~~~~~~~~~~~~~~~~~~~
I chose the point where the graph crosses the y-axis (y intercept).
To do this we set
'~~~~~~~~~~~~~~~~~~~~~~~~~~~~~~~~~~~~~~~~
Substitute this in our equation and we have
'~~~~~~~~~~~~~~~~~~~~~~~~~~~~~~~~~~~~~~~~~
#color(magenta)("Do not forget the extend the line to the edges of the graph.