How do you graph #x+2y=6# by plotting points?
1 Answer

Mar 9, 2018
Isolate one of the variables and then make T-chart
Explanation:
I'll isolate x since it's easier
Now we make a T-chart
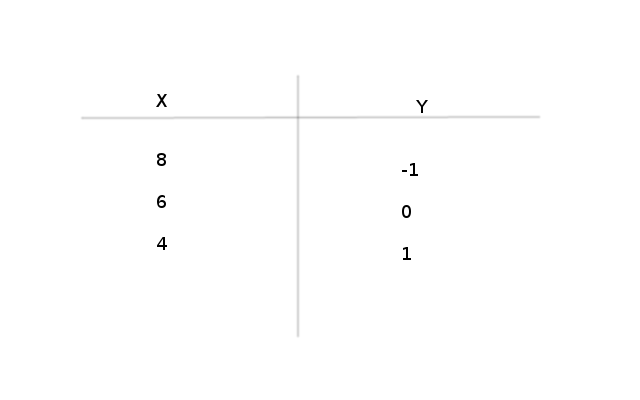
And then graph those points. At this point you should notice it is a linear graph and there is no need to plot points, you only have to slap down a ruler and draw a line as long as necessary
