How do you graph #x^3 - 4x + 1# by plotting points?

1 Answer
Jul 24, 2018

#" "#
Please read the explanation.

Explanation:

#" "#
We are given the Cubic Function: #color(red)(y=f(x)=x^3-4x+1#

To find the y-intercept:

Set #color(blue)((x=0)# to find the corresponding of #color(blue)((y))#

#y=0^3-4(0)+1#

#y=1#

Hence, we understand that #color(blue)((0,1)# is the y-intercept of the graph of the given cubic function.

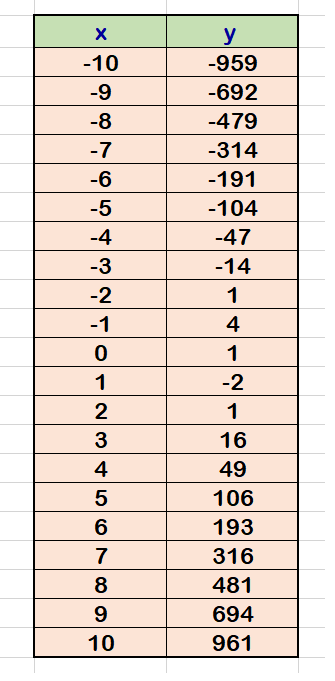
Create a data table with values as shown:

enter image source here

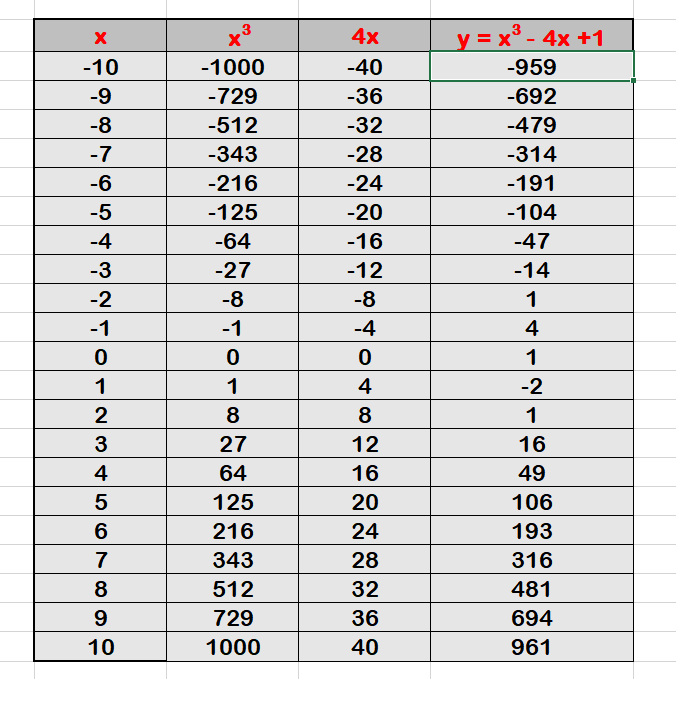
The table below, displays #color(red)((y=1)# when #color(red)((x=0)#

enter image source here

#color(blue)((0,1)# is the y-intercept of the graph of the given cubic function.

Using an appropriate graphic software or a calculator, we can obtain the graph as shown below:
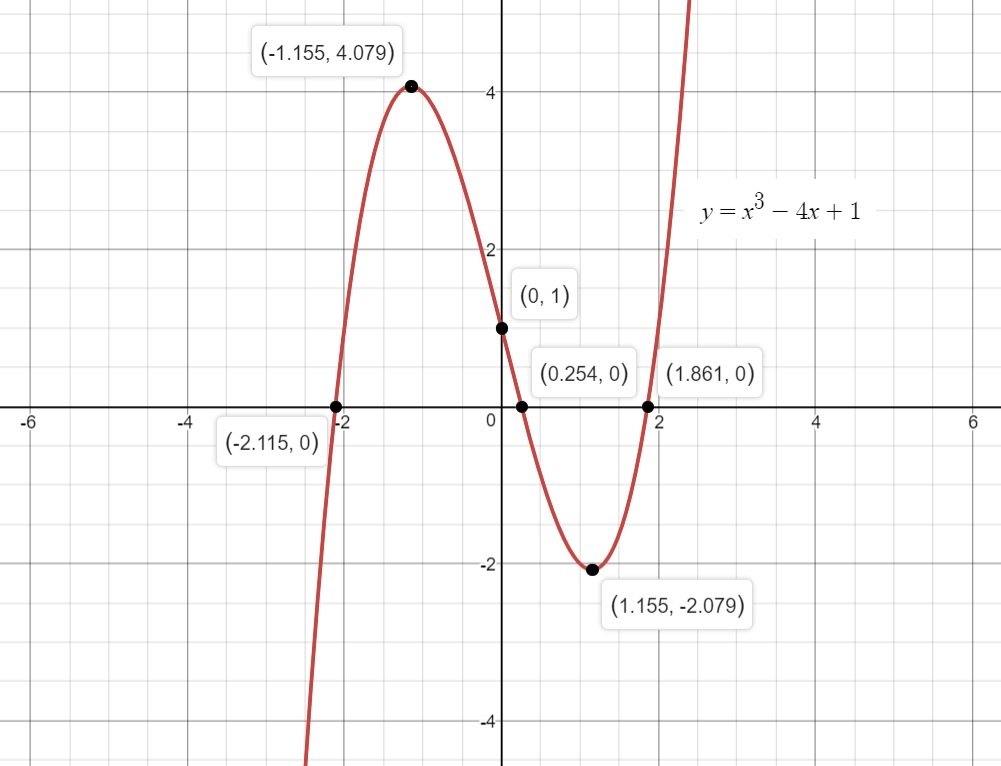
enter image source here

Solutions for x:

There are three solutions, as #color(red)(f(x)# is a Cubic function.

#color(blue)(x_1 ~~ 1.86081#

#color(blue)(x_2 ~~ -2.11491#

#color(blue)(x_3 ~~ 0.2541#

Hope it helps.